
Pet food seems like one of the last things people would experiment with. Once a dog or cat finds something they like, why change it?
Yet Packaged Facts' August 2026 survey found that nearly half of US dog and cat food buyers had changed foods within the previous 12 months. Interestingly, shoppers were slightly more likely to move toward higher-priced options than cheaper alternatives.
Clearly, price alone can't explain what's happening.
Pet owners are reconsidering what deserves their money, with health benefits, convenience, and perceived quality influencing their decisions.
Let's explore the pet industry trends behind these changing priorities and what they mean for marketers in 2026.
TL;DR: Pet Industry Trends That Change Your Marketing in 2026
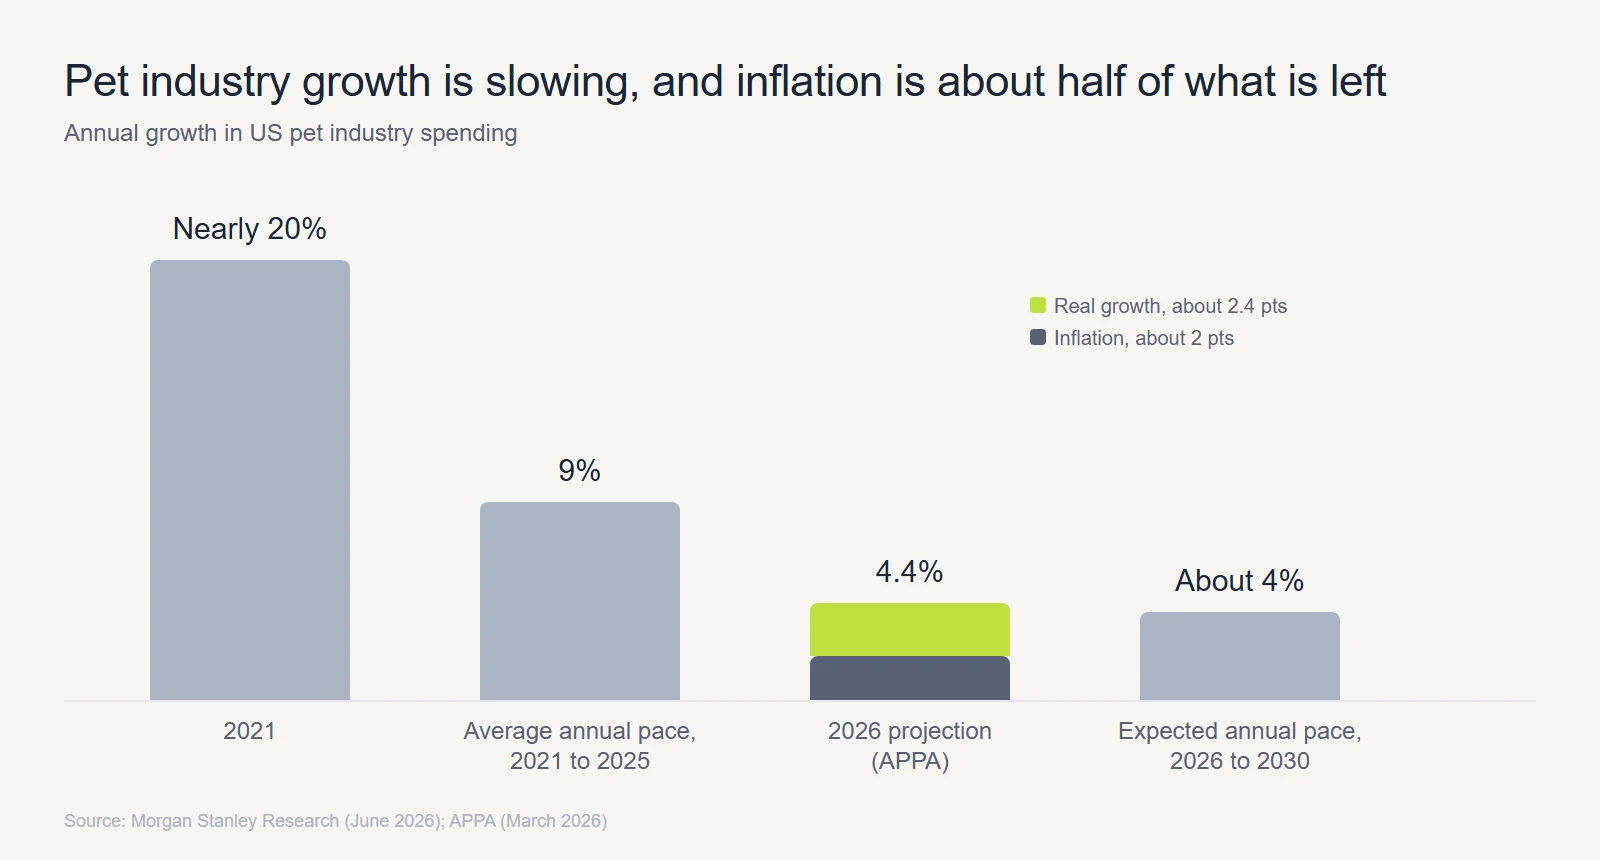
- Market expansion is slowing. Morgan Stanley projects about 4% annually through 2030, making market-share gains more important.
- Owners continue to prioritize food and healthcare, while optional purchases face pressure. APPA reports an 11% drop in dog treat spending.
- Veterinary bills are harder to manage: Gallup found that 52% of owners skipped or declined recommended care, and 71% of those respondents cited cost.
- Younger consumers are adding pets despite tighter budgets, and many still discover products in physical stores.
- Look beyond first-order ROAS. Repeat purchases, retention and CAC payback help show whether acquisition is paying off.
Published surveys tell only part of the story. Search patterns, comment threads and creator replies can reveal emerging concerns that brands can turn into campaign hypotheses.
The same message rarely works for every owner. Someone worried about an older dog's veterinary bills needs different reassurance from a first-time cat adopter. The sections below connect those concerns to practical campaign decisions.
What Are the Biggest Pet Industry Trends in 2026?
Seven pet industry trends stand out in 2026, spanning household spending, changing attitudes toward pets, insurance and younger cat owners. The table sets out the evidence before we look at the marketing implications.
| Trend | Evidence |
|---|---|
| Slower growth | Growth expected to slow to about 4% a year through 2030 |
| Humanization | 66% of owners consider pets part of the family |
| Value-seeking | Dog treat spending down 11%, discount-retailer buying up 22% |
| Health first | Vet services prices up 4.7%, 52% of owners skipped or declined care |
| Insurance | 4.27% of US pets insured, premiums up 19.7% |
| Younger, cat-led ownership | Cats in 39% of households, Gen Z 22% of cat owners |
| Smaller categories | Cat sitting, GPS collars and sustainable products each need their own channel mix |
General Mills offers a useful example of the tension between pricing and demand. In its first quarter of fiscal 2027, North America Pet net sales were $612.8 million, nearly flat on $610 million a year earlier.
Despite the nearly flat revenue figure, volume fell six points while price and mix added seven. Cat food sales increased by double digits, whereas dog food declined by a high single-digit rate.
For brands facing similar pressure, pet food marketing needs to explain why a product is worth buying, particularly when unit volumes are under pressure.
How Big Is the US Pet Market in 2026, and Who Owns Pets?
US pet spending reached $158 billion in 2025. APPA projects roughly 4.4% nominal growth in 2026, with about two percentage points attributed to inflation.
On that basis, estimated real growth is roughly 2.4%, although this is an approximation rather than an official inflation-adjusted figure. The category breakdown puts that outlook into perspective.
Pet Industry Spending: $158 Billion in 2025, About $165 Billion Projected
Food and treats take the largest slice of pet industry spending at $68.3 billion in 2025, followed by vet care at $41.0 billion.
The category split helps show which expenses account for most household pet budgets.
| Category | 2025 actual | 2026 projection | Share of 2025 spend |
|---|---|---|---|
| Food and treats | $68.3B | $69.7B | 43% |
| Supplies, live animals and OTC meds | $34.4B | $35.6B | 22% |
| Vet care and product sales | $41.0B | $42.4B | 26% |
| Other services | $14.3B | $14.9B | 9% |
Importantly, APPA includes grooming, boarding, sitting, training and insurance under "other services." The figure therefore describes more than grooming alone.
There is one discrepancy worth noting: APPA's four 2026 category projections total $162.6 billion, rather than the $165 billion headline. The headline provides the overall estimate; the individual figures describe the reported category mix.
For marketers, a slower real-growth outlook suggests three priorities:
- Define 2027 targets by specific audiences, such as owners choosing basic dog diets or people adopting their first cat, rather than relying on overall market expansion.
- Fund creative testing from the budget line that used to buy reach. Consumer spending trends across categories point the same direction: value is the default filter.
- Separate sales volume from pricing effects in reporting. As General Mills demonstrates, stable revenue can conceal weaker unit demand.
Pet Ownership Statistics: 95 Million Households and a Shift Toward Cats
About 95 million US households own a pet. Dogs are in 53% of all US households, up from 51% in 2024, according to APPA's 2026 report. That is roughly 71 million dog households and about 4 million more than a year earlier.
Cats are in 39% of households, around 53 million homes, and Gen Z is 22% of cat owners, up 10% year on year, per APPA's Cat Report. Gen X ownership grew 12% year on year, which APPA ties to empty-nest households adding pets.
The US pet population stands at about 87.3 million dogs and 76.3 million cats, per AVMA data cited by NAPHIA.
Before comparing ownership estimates, check the unit being measured. APPA counts households, whereas the consumer surveys below measure individual respondents.
Morgan Stanley's March and April AlphaWise survey of 2,500 consumers found 67% own a pet, down from 69% in 2024, and affordability has overtaken care responsibilities as the top reason for not owning one.
Generational estimates also differ: Cascadia puts Millennials at 33% of owners, while an APPA-based summary gives 30%. Both describe each generation's share of all owners, which is a different quantity from how likely each generation is to own a pet.
Together, those findings suggest three audiences worth examining:
- Younger cat owners. With cats gaining attention among younger consumers, campaigns should address cat-specific needs rather than simply adapting dog-focused ads.
- Gen X empty-nesters. APPA associates their increased ownership with children leaving home, suggesting an opportunity to speak to the experience of welcoming a new companion.
- Cost-conscious prospective owners. Morgan Stanley finds that affordability is holding back some would-be adopters, making existing customer relationships especially valuable.
How Gen Z and Millennial Pet Owners Shop and Discover Brands
Younger pet owners present a useful contrast: APPA identifies them as an important source of new ownership, while Morgan Stanley highlights their exposure to rising costs. Their shopping habits are also broader than social media alone.
APPA's survey, as reported by Pet Food Processing, found that 57% of Gen Z and 61% of Millennial owners rely on in-store browsing to find new products.
Online purchasing remains common: 51% of Gen Z and 57% of Millennial respondents bought pet products online. Meanwhile, Gen Z subscription use slipped from 61% to 55%. So even digitally active customers may discover or purchase products through specialty shops and mass retailers.
Cascadia Capital's winter 2025/2026 overview, relayed by Pet Food Industry, says Gen Z is 25% of owners, the fastest-growing segment. It lists Nom Nom, Freshpet, Spot & Tango and BarkBox among brands using TikTok Shop.
That points to growing interest in TikTok Shop, but the report offers no ROI data to establish how well these efforts convert.
Tractive shows the catch. At a Modern Retail panel, its North America EVP Andrew Bleiman said selling on TikTok is easy, but "the percentage of people who subscribe falls off a cliff."
He also said 95% of US pet owners do not know GPS trackers exist, which is the executive's own estimate. The creators who work best for Tractive, he said, are smaller ones.
This mix of online attention and physical-store discovery calls for a few adjustments:
- Use TikTok and Reels to introduce products and answer initial questions. Then make the next step clear through a product page, retailer listing or relevant offer.
- Connect creator demonstrations to store-locator pages or nearby stockists, since discovery and purchase can happen in different places.
- Brief creators on the owner's life stage (first apartment, first cat, adult child gone) so the persona does the targeting. Our guide to borrowing Gen Z trust from creators covers the briefing side.
Pet Humanization: How Pet-Parent Language Became the Creative Brief
The idea of pets as family is becoming more common. In Morgan Stanley's survey, 66% of owners described them that way, compared with 63% in 2024.
For advertisers, that creates room for messages about companionship, daily routines and care. Yet emotional relevance still needs to fit the household budget. Two 2026 campaigns illustrate the balance.
Blue Buffalo's Love Made Fresh Dog Tax Credit let owners "claim" their dog as a dependent for a chance at a $1,000 credit toward its fresh dog food line.
According to General Mills, searches for pet-related tax deductions increased 40% from 2024 to 2025.
The company published neither the underlying search data nor campaign outcomes, so the example illustrates how a familiar owner question can shape a campaign concept, rather than proving its effectiveness.
Petco went the other way on price. Its Never Naughty, Always Nice holiday collection put 70% of its hundreds of new arrivals at $10 or less and added buy-one-get-one offers. Family language stayed, but the entry price did the persuading.

To explore a similar idea in your own category:
- Start with questions and concerns appearing in search suggestions, comments and creator replies.
- Choose a recognizable situation, such as a newly adopted rescue, an empty-nest household or a first-time pet parent.
- Develop two distinct messages: one centered on the relationship, the other on a practical benefit.
- Run both as dark posts with the same creator and read CPA at creative level.
- Keep the angle that delivers efficient acquisition without compromising repeat-purchase performance.
Value-Seeking Pet Owners: Where Pet Care Spending Holds and Where It Gets Cut
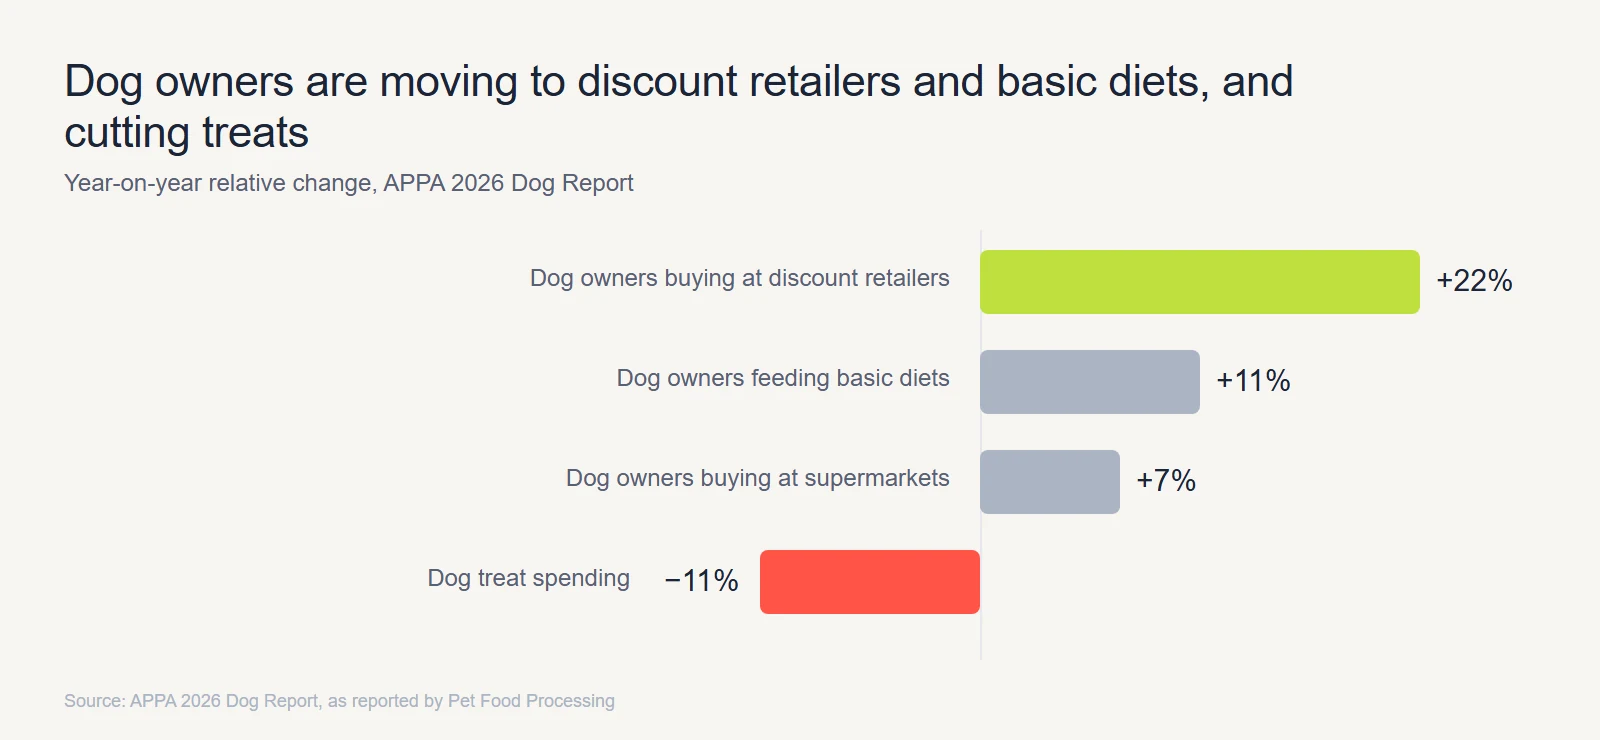
The distinction between essentials and extras becomes clearer in APPA's 2026 Dog Report. Basic diets reached 21% of dog owners, an 11% year-on-year increase, while treat spending fell 11%. Those figures suggest that shoppers are reassessing discretionary purchases more readily than everyday nutrition.
Shopping locations are changing too. The report places 32% of dog owners at supermarkets, a 7% year-on-year rise, and 22% at discount retailers, up 22% relative to the previous year. These figures reflect where people shop, rather than proving a move to private-label food.
Across the broader market, APPA finds that about half of owners maintained their spending, while 22% spent less in 2025. The overall picture is selective budgeting rather than uniform cutbacks.
Still, lower discretionary spending does not mean every customer is trading down. The table pairs category-level signals with advertising approaches brands can evaluate.
| Category | What owners are doing | Evidence | Marketing response |
|---|---|---|---|
| Core food | Protecting everyday food needs while comparing value | Basic diets at 21% of dog owners | Show price per serving and everyday nutrition benefits |
| Treats | Cutting back | Dog treat spending down 11% | Test training, dental-care and bundle offers against indulgence-led messages |
| Fresh and premium | Some fresh-food brands are expanding despite price pressure | Freshpet net sales up 10% | Support premium positioning with product-specific evidence and accessible trial sizes |
| Subscriptions | Subscriptions remain important, although Gen Z adoption has softened | Gen Z subscription use down from 61% to 55% | Explain skip, swap and pause options before checkout |
| Discount channels | Increasing use of lower-priced retail outlets | Discount-retailer buying up 22% among dog owners | Show prices and retailer availability after social discovery |
Freshpet is the counter-signal: net sales rose 10% to $317.8 million in the third quarter on 10% volume growth, and it raised its full-year outlook to 12% to 13%. It also passed $1 billion in annual sales for the first time.
Chewy shows the subscription side. In its second quarter of fiscal 2026, Autoship customer sales were $2.82 billion, 84.6% of net sales, and net sales per active customer were $602. In May it consolidated four private labels under Chewy Made, and no result has been disclosed.
Petco illustrates an execution risk. After relaunching its membership program, the company reported net sales growth of just 0.05% and a sales disruption related to stronger-than-expected points redemption.
That experience makes offer design worth testing carefully; it does not, by itself, demonstrate a decline in gross margin.
Here is how brands can respond to these spending patterns:
- For everyday food and health products, explain the benefit clearly and make the price per serving easy to compare.
- For treats, compare functional uses such as training or dental care with bundle-led offers.
- Use the protect, pause, stop test before cutting any media line, and cap the discount depth you test.
Preventive Care and Veterinary Costs: Where Pet Healthcare Marketing Is Heading
Veterinarian services prices rose 4.7% in the 12 months to July 2026, against 3.4% for all items, according to the Bureau of Labor Statistics.
By comparison, pet services prices rose 5.1%, while food and treats increased 1.3%. Morgan Stanley also estimates that services accounted for more than 40% of 2025 industry spending and expects that share to increase. Its definition differs from APPA's categories, so the two estimates should be read separately.
Even as bills rise, veterinarians remain influential: roughly 60% of owners identify them as a trusted source of pet care advice. That gives brands an important communication opportunity, provided claims are properly supported.
Veterinary Costs and Declined Care: What the Gallup Data Shows
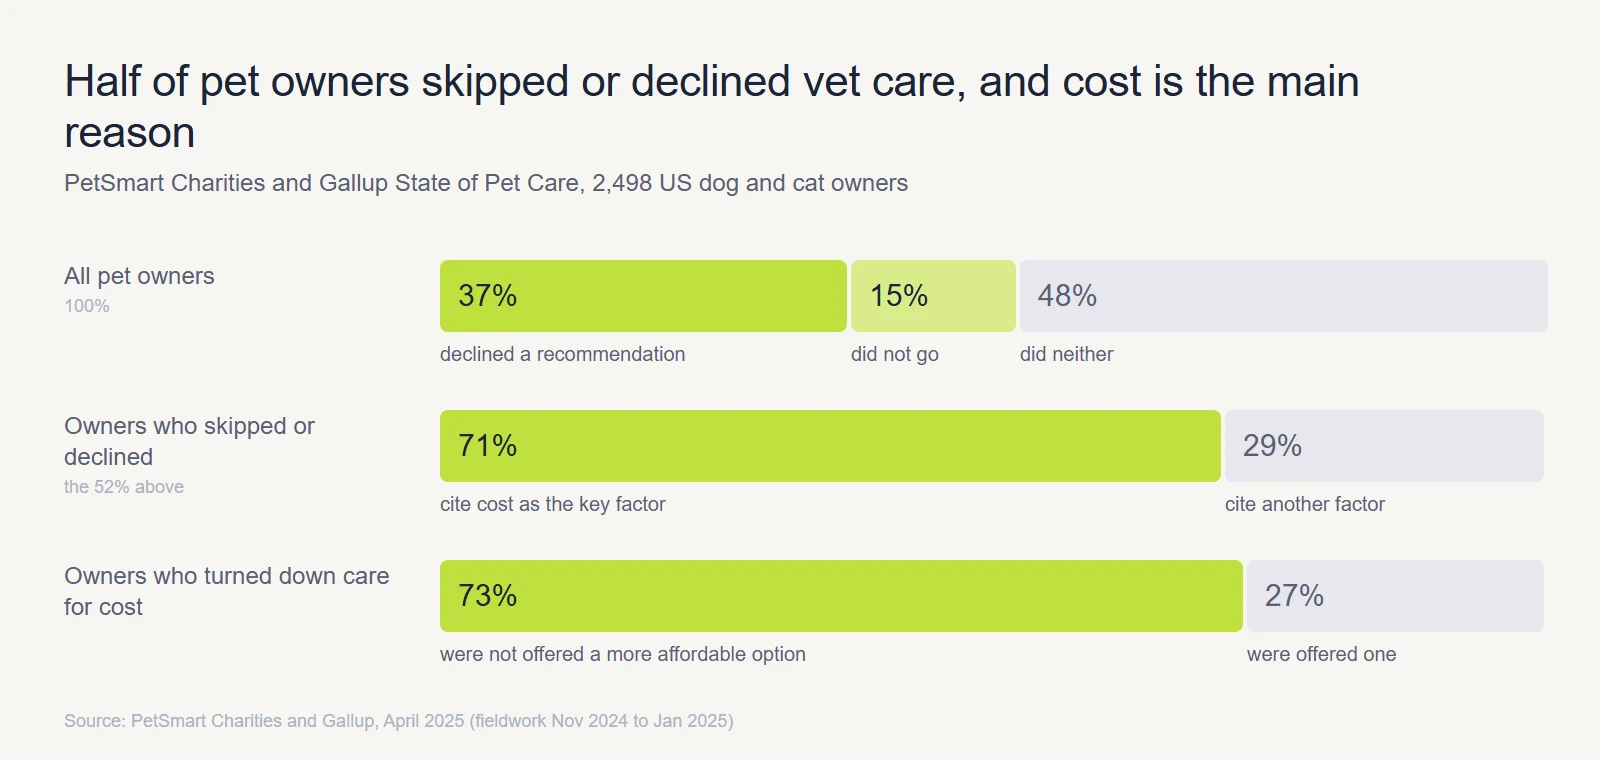
Gallup's State of Pet Care survey found 52% of US dog and cat owners skipped needed veterinary care in the past year: 37% visited but declined one or more recommendations, and 15% did not take the pet in at all.
Cost was the most common obstacle: 71% of those who declined or skipped care cited it, and 73% of respondents who refused care because of cost said they were offered no more affordable alternative.
Among all owners, declined care was most often diagnostics (22%) and preventive care such as vaccinations (18%). Fieldwork ran from November 2024 to January 2025, so this is a historical snapshot rather than a direct measure of 2026 behavior.
The findings suggest that access and clarity matter alongside price.
People who care deeply about their pets may still postpone tests or preventive visits when costs are uncertain. Clear explanations of available care options, expected expenses and when to consult a veterinarian can help them make better-informed decisions.
Preventive Care Marketing: Chewy, Hill's and the Vet-Voice Playbook
Brands have responded on two fronts: improving access to veterinary care and helping pet parents sort through conflicting advice. Chewy and Hill's provide contrasting examples from 2026.
Chewy acquired Modern Animal, which brings 29 owned clinics and a membership model and takes Chewy Vet Care from 18 to 47 locations.
According to Chewy, the acquisition adds more than $125 million in annualized run-rate revenue. These projections come from the company itself.
Hill's "Try Again" campaign, made with VML, works on the information problem. LBB's write-up describes pet parents stuck in "echo chambers" of Reddit threads, TikTok advice and AI search, and says the campaign aims to drive vet engagement and visits across dermatology, obesity and mobility, GI and urinary conditions. No results were disclosed.
For health-focused campaigns, the priorities are slightly different:
- Put a vet or credentialed voice first on any health claim, and brief creators to point owners to the vet. Our guide to healthcare creators covers briefs and disclosure.
- State the affordability step in the ad itself (payment option, preventive bundle, trial size).
- Track assisted vet visits or clinic bookings as a lead metric for health products.
How to Market Pet Wellness Products Without Overclaiming
When promoting wellness products, start by separating everyday support from claims about diagnosing, treating or preventing disease.
Describe the intended benefit in everyday terms and check it against the evidence and product labeling. Food and supplements should never be presented as substitutes for veterinary care. Professional credentials can help explain an existing claim, but cannot establish its validity.
To keep the message consistent, give creators approved wording and disclosure guidance, then review the footage, captions and landing page as a complete set.
Pet Insurance Growth: What 4.27% Penetration Means for Marketers
Only 4.27% of US pets are insured (5.99% of dogs and 2.29% of cats), while US premiums grew 19.7% to about $5.7 billion in 2025, according to NAPHIA's 2026 State of the Industry report.
Premium revenue continues to rise, but at a slower pace: annual growth moved from 24.2% in 2022 to 21.4% in both 2023 and 2024, before reaching 19.7% in 2025.
Cats account for just 25.1% of insured pets, making them a comparatively underinsured audience. Cat premium revenue increased 33.1%, versus 17.6% for dogs. Meanwhile, average accident-and-illness premiums reached $836 for dogs and $435 for cats.
Trupanion's third quarter shows the retention angle. Its subscription revenue grew 14% to $287.9 million, and its CEO called it the seventh consecutive quarter of better retention. Total enrolled pets fell 2%, so revenue grew on fewer pets.
For insurance marketers, the implications are more specific:
- Start by explaining coverage boundaries. Standard accident-and-illness plans often exclude checkups and vaccinations unless additional wellness benefits apply, so advertising and partnerships should make that distinction explicit.
- Consider educational campaigns for cat owners, where coverage is less common and premium revenue is rising faster. Low penetration alone, however, does not establish demand.
- Renewal messages should explain changing prices alongside benefits and claims support. With average premiums up 11.5% for dogs and 12.6% for cats, clarity matters.
Pet Services, Pet Wearables and Eco-Friendly Products: Smaller Categories, Different Playbooks
Food and veterinary care account for much of the market, but smaller categories solve different customer problems. A pet sitter needs trusted local reviews, a GPS collar benefits from a clear demonstration, and an environmental claim calls for specific supporting evidence.
Pet Grooming, Boarding, Daycare and Sitting
APPA's broad "other services" category totaled $14.3 billion in 2025, with $14.9 billion projected, and includes insurance.
It does not provide separate market sizes for grooming, boarding, sitting or daycare. Its Dog Report also describes owners shifting some higher-cost services, including grooming, into the home to save money.
Rover's January 2026 purchase of cat-sitting marketplace Meowtel is one example of investment in cat-specific services. Meowtel has over 4,000 providers serving more than 125,000 cats in over 8,000 cities, and Rover left the terms undisclosed. The acquisition is a market signal, although it does not quantify category-wide demand.
- For grooming and boarding, use local testimonials and relevant visual examples to show what customers can expect.
- Concentrate paid social within the service area, then compare cat-specific offers with broader messaging.
Pet Wearable Market: Fi, Tractive and the Subscription Problem
Published market-size estimates for pet wearables are difficult to compare reliably. For campaign planning, a product demonstration and the share of trial users who subscribe offer more actionable evidence than an uncertain industry total.
Fi's Fi Ultra campaign, "Unleash the Wild," made by Dolsten & Co., uses AI-generated photoreal dogs across digital, social and TV. Fi disclosed no result.
That concern also appears in Tractive's account of converting social-media interest into paying subscribers.
Show a concrete ongoing benefit, such as location tracking or health alerts, early in the ad. Then measure whether creator demonstrations lead to paid subscriptions, rather than clicks alone.
Eco-Friendly Pet Products
Sustainability is a second reason to buy, and a certified claim beats a vague one. NielsenIQ's Andrea Binder said at Global Pet Expo that households with one dog or cat are about 6% more likely to buy environmentally sustainable products, rising to as much as 28% for homes with three or more pets.
At the same time, upcycled-product claims increased 60% year on year, while just 3% to 4% of pet care products carry a certifiable sustainability claim. That gap makes substantiation especially important.
Use a credible certification or a specific, substantiated environmental claim, and keep sustainability secondary to the product's main benefit.
How to Build a Pet Marketing Test Plan Around Changing Owner Behavior
To turn these trends into decisions, choose two customer behavior changes that affect your category and compare the response to each over four weeks.
- For example, a fresh-food brand could compare value-focused messaging with family-centered creative. A pet health brand could explore veterinary affordability and the needs of younger cat owners.
- Map each audience to a specific concern and a single advertising promise. This keeps the comparison focused.
- Brief micro pet creators and one vet voice. Source at volume and match creators to the persona. Our guide to pet influencer marketing covers casting and vetting.
- First run the variations as paid creator ads so their results can be compared before expanding distribution.
- Compare CPA and CAC by message and offer, since platform-level ROAS can obscure differences between the variations.
- Increase spend only after one approach meets the agreed threshold, and record why it worked for that audience.
The following matrix shows four possible combinations. For an initial test, select only the two most relevant to your product.
| Owner persona | Behavior shift | Creative angle | Offer | First metric |
|---|---|---|---|---|
| Budget-stretching dog owner | Value-seeking | Price per serving, ingredient proof | Trial size or bundle | Cost per first order |
| First-time Gen Z cat owner | Younger, cat-led ownership | Starter routine, first-month checklist | Starter kit | Cost per first order |
| Anxious senior-dog owner | Health first | Vet voice explains the preventive step | Vet-led education with a payment option | Cost per lead or booking |
| Fresh-food switcher | Humanization | Daily meal as a family ritual | Subscription with skip and pause | Second-order rate |
Our UGC agency builds this kind of persona-matched creator content for brands, so every cell of the matrix gets real clips.
Keep the initial spend limited and reallocate from a lower-priority media line, following the protect, pause and stop framework introduced earlier.
How to Measure Pet Marketing in a Slower-Growth Market: Repeat Rate, Retention and Payback
A profitable first purchase tells only part of the story. Track repeat purchase rate, customer retention and CAC payback alongside first-order ROAS, particularly when the economics depend on subsequent orders.
| Metric | What it tells you | How to read it |
|---|---|---|
| CAC | Cost to win a new customer | Compare by creative cell, not by platform |
| Repeat purchase rate | Whether the offer worked beyond the discount | Look at the second order inside 90 days |
| Subscription retention | Whether owners stay | Watch skips and cancels by cohort |
| CAC payback | Days or orders to recover CAC | Use contribution margin, not revenue |
| MER | Total revenue per total marketing dollar | Use it as the scoreboard when platforms overlap |
| Assisted vet visits or scan lift | Offline outcomes for health and retail | Pair with geo-matched holdout tests |
BARK illustrates the trade-off between acquisition efficiency and customer volume. Its advertising and marketing expense fell to $59.2 million in fiscal 2026 from $83.8 million as the company reduced acquisition spending it considered less efficient.
In the second quarter of fiscal 2027, DTC revenue fell 24.7% to $61.8 million while subscriber retention improved to 94% and commerce revenue rose 3.6%.
BARK attributed its smaller DTC subscriber base partly to reduced marketing spend, although the figures alone cannot isolate that effect.
A simplified example shows why subsequent purchases matter:
| Input | Illustrative value |
|---|---|
| CAC | $40 |
| First-order value | $60 |
| Contribution margin after variable costs | 45% |
| Contribution per order | $27 |
| Second-order rate within 90 days | 50% |
| Expected contribution by day 90 | $40.50 |
In this simplified model, a $60 order with a 45% contribution margin produces $27 toward recovering CAC.
If half of buyers place a second order within 90 days, expected contribution reaches $40.50 per acquired customer, just covering a $40 CAC.
At a 30% second-order rate, it falls to $35.10, leaving CAC unrecovered at day 90. The margin assumption must include applicable variable costs.
Before increasing a channel's budget, consider a holdout test to separate incremental sales from purchases that returning customers would have made anyway.
Turn Pet Industry Trends Into Better Campaign Decisions
There's a difference between reaching pet owners and earning their next purchase. Campaigns that answer real questions about nutrition, price, and convenience give people something useful to act on.
For The Farmer's Dog, inBeat supported $20M+ in annual ad spend across 10+ channels, with 70+ creator-led assets produced each month.
If you're ready to make your next campaign more useful to pet owners, book a strategy call with inBeat Agency.
Pet Industry Trends FAQs
How can pet brands tell whether customers are switching for price or better quality?
Start with post-purchase feedback and buying patterns to understand what prompted the change. If price is driving the decision, test clearer unit pricing or bundles. If perceived quality matters more, explain ingredients or offer an accessible trial. Packaged Facts' 2026 finding that nearly half of surveyed food buyers switched products is a reason to investigate those motives, rather than assuming every change is a trade-down.
Why do APPA's 95 million households and Morgan Stanley's 67% ownership figure disagree, and which should a media plan use?
The studies measure different things: APPA counts households, while Morgan Stanley surveys individual consumers. For media planning, use household figures to estimate reach and the consumer survey to understand directional changes. Combining them in one calculation would be misleading.
When should a pet brand refresh creative if customer priorities keep changing?
Review messages when acquisition costs rise or customer comments reveal a concern the current ads fail to address. Compare performance by customer need and offer, rather than relying on age or platform alone. Keeping a proven control running alongside a new angle helps distinguish creative fatigue from a genuine change in demand.
How do you set a creator test budget when real market growth is estimated at around 2.4%?
Set a budget large enough to evaluate a defined outcome, but small enough to limit the downside. One approach is to run four to six variations over four weeks using funds reallocated from lower-priority media. Agree on an acceptable acquisition cost before increasing spend.
How can pet brands connect in-store sales to creator campaigns?
Connect the ads to retailer-specific pages, store locators or trackable promotions where possible. To estimate incremental sales more reliably, compare matched retail regions with and without the campaign, then examine sell-through against advertising spend. Click data alone can miss purchases made later in stores.
What should marketers check before using a veterinarian or creator in a pet wellness ad?
Check credentials, content rights, sponsorship disclosures and substantiation before production. The spoken message, on-screen text, caption and landing page should agree. Health-related statements must match the available evidence and applicable requirements; where owners need medical guidance, direct them to a veterinarian rather than implying that a product replaces professional care.