.svg)
.svg)
.svg)
.svg)


.svg)






How much should an influencer post cost in 2026?
Depending on the benchmark, the same creator tier can look four times more expensive in one dataset than another. Survey estimates, marketplace averages, and actual transaction prices tell different stories, leaving marketers with a difficult question: which numbers can they trust?
The stakes are already high. Creator costs account for 35.4% of reported marketing challenges, making them the top concern even as influencer budgets continue to rise. But the price per post tells only part of the story.
This report compares creator costs and engagement rates across sources, then examines two often-overlooked factors: approval timelines and paid-usage fees. The goal is to show what the numbers actually mean when planning and pricing a campaign.
P.S. If you'd rather start from a benchmark-led plan, our influencer marketing agency builds and tests creator programs against numbers like these.
TL;DR: Key Influencer Marketing Statistics for 2026
| Section | Key figure | Source |
|---|---|---|
| Costs | Median creator rate runs from $134 for nano to $2,727 for mega per deliverable | OpenSponsorship |
| Engagement | TikTok brand accounts averaged 3.70% engagement by followers, Instagram 0.48% | Socialinsider |
| Approval time | No comparable benchmark found in the reports reviewed; 89% of marketers say content passes 3 or more approval stages. | Adobe |
| Paid usage rights | 67% of brands include usage rights in the creator's initial contract or rate | Aspire |
| Budgets | 87.49% of marketers expect to raise influencer budgets | Influencer Marketing Hub |
| Platforms | Instagram is used by 90.6% of European organizations, TikTok by 66.5% | Kolsquare |
| Tier mix and formats | 51.43% plan to expand nano creator use | Influencer Marketing Hub |
| KPIs and payback | 89% of budget increasers select brand awareness | Influencer Marketing Hub |
| Fraud | 56.5% of reported issues are fake or bot followers | Influencer Marketing Hub |
| AI | 36.67% of AI uses are creator discovery | Influencer Marketing Hub |
| Operating model | 66.33% of respondents manage influencer marketing entirely in-house, according to Influencer Marketing Hub. | Influencer Marketing Hub |
One thing before the numbers. We treat creators, paid media, and measurement as one loop. Creators supply native ads that are ready to test, paid media is where those ads prove themselves, and your own cost per result decides which creator earns the next booking.
A benchmark gives that loop a starting guess. The medians below tell you where a quote sits in the market. Your campaign data tells you whether the creator is worth booking again.
Influencer Marketing Cost Benchmarks for 2026
Median creator rates run from $134 per deliverable for nano creators to $2,727 for mega creators, based on 1,527 paid deliverables. Marketplace averages land higher or lower depending on whether they count asking prices or final payouts, so the tables below name the statistic type.
Median Influencer Rates by Creator Tier
A nano deliverable costs about 5% of a mega deliverable at the median, and the nano and micro medians sit $16 apart. The mid tier then triples the nano rate.
| Tier | Followers | Median rate | Median views | Deliverables |
|---|---|---|---|---|
| Nano | Under 10K | $134 | 1,115 | 146 |
| Micro | 10K to 50K | $150 | 989 | 349 |
| Mid | 50K to 250K | $417 | 2,606 | 513 |
| Macro | 250K to 1M | $517 | 6,974 | 441 |
| Mega | 1M and above | $2,727 | 20,123 | 53 |
Source: OpenSponsorship, 1,527 completed paid deliverables, January 2025 to June 2026, cash fees only. Medians.
The medians exclude gifted product, so the true cost of a deal that included product is higher than the table shows. The mega tier rests on 53 deliverables, which makes it the least stable row.
The tier rows total 1,502 deliverables, compared with 1,527 in the full dataset, because follower counts were unavailable for 25 deliverables.
Ten factors that move an individual quote, from niche to turnaround, are listed in our creator pricing guide.
Average Influencer and UGC Rates by Platform: Asking Price and Actual Payout
Collabstr reports average listed package prices alongside payouts from completed collaborations. Twitch shows the widest gap, with an average listed price of $398 against a $127 payout. However, these figures come from different sets of listings and transactions, so the difference should not be treated as a typical negotiated discount.
| Platform | Average asking price | Average payout | Average payout / average listed price |
|---|---|---|---|
| Twitch | $398 | $127 | 32% |
| YouTube | $311 | $255 | 82% |
| $214 | $193 | 90% | |
| Amazon | $193 | $88 | 46% |
| TikTok | $182 | $186 | 102% |
| UGC | $180 | $154 | 86% |
| X | $179 | $76 | 42% |
Source: Collabstr 2026 Influencer Marketing Report, 472,000+ listed packages and 21,000+ completed collaborations, 2025 marketplace data. The final column is calculated from platform-level averages and does not represent the average discount negotiated on individual collaborations.
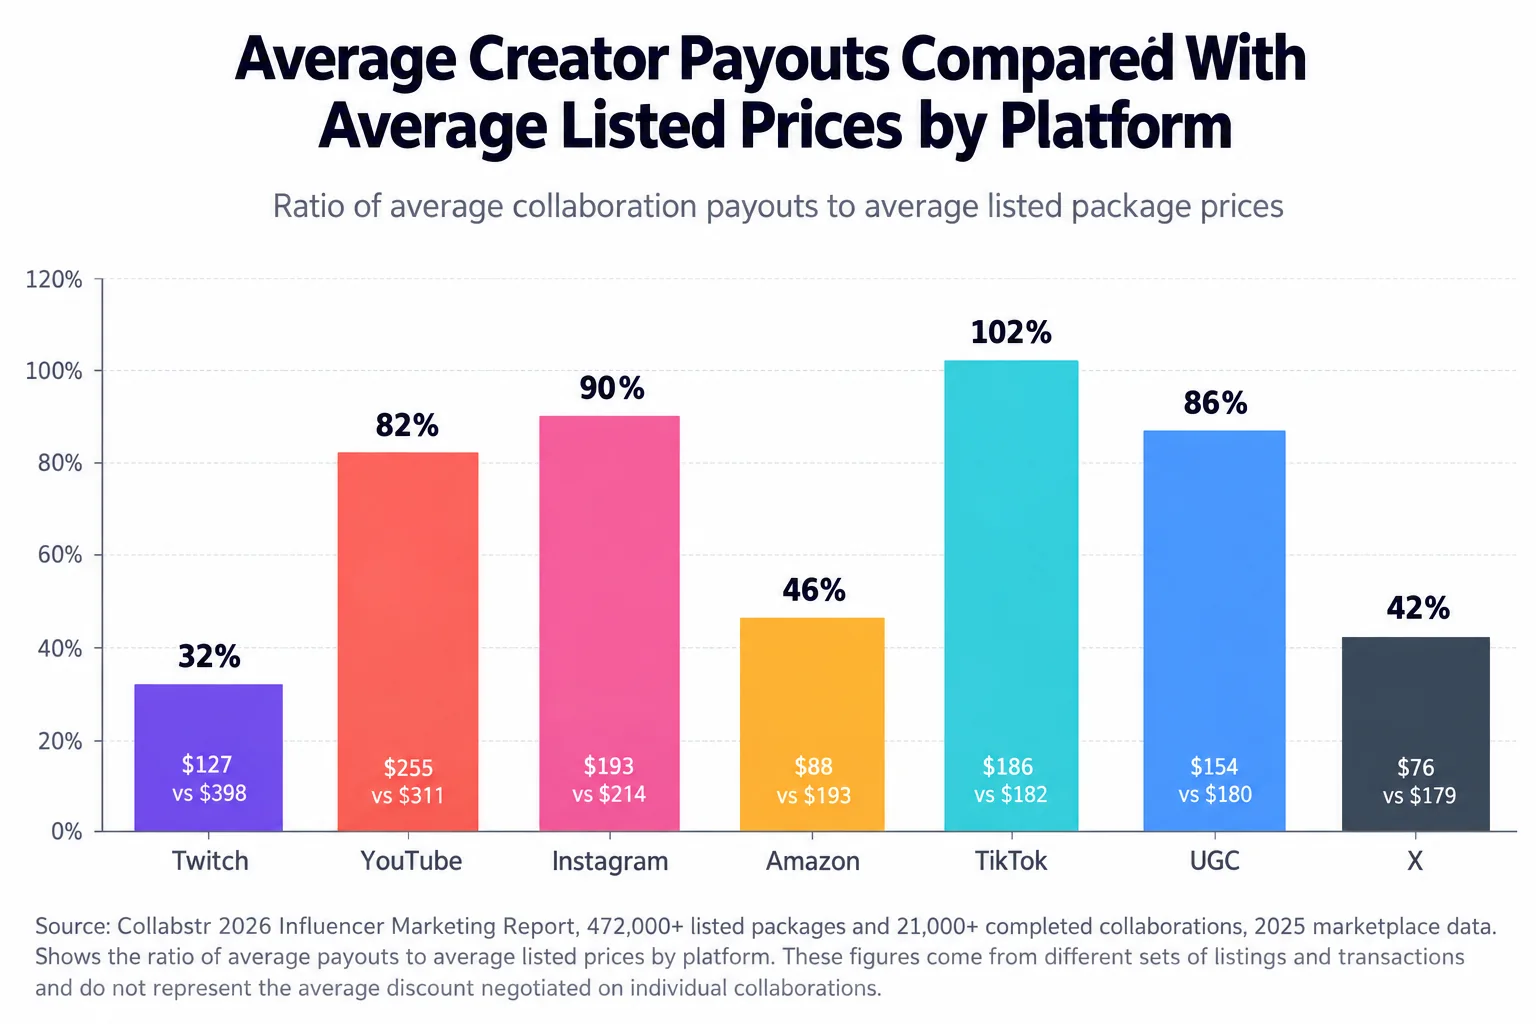
Four more figures from the same report:
- 80% of collaborations cost under $300, 18% cost $301 to $1,000, and 2% cost more than $1,000.
- YouTube payouts fell 39% year over year, from $418 to $255 (our calculation; Collabstr's report states 63%, which its own figures do not support).
- TikTok's share of all Collabstr collaborations halved from 41% to 21% in 2025, while UGC campaigns rose from 15% to 35%.
- UGC shows three different averages in the same report: a posted rate of $180, a payout of $154, and an average campaign cost of $197, down 5.7% from $209. The report does not reconcile them, so each one stands as its own measure.
For bundle discounts and add-on pricing on UGC specifically, see our UGC rates guide.
Influencer Cost per View and Cost per Engagement Benchmarks
The largest creators buy views most cheaply, and the smallest creators buy engagements most cheaply. At the median, mega creators deliver views at $0.07 against $0.13 for nano creators, while nano and micro creators deliver engagements at about $3 against $5.00 for mega.
| Tier | Median cost per view | Median cost per engagement | Views per follower |
|---|---|---|---|
| Nano | $0.13 | $3.11 | 19.9% |
| Micro | $0.14 | $3.05 | 4.6% |
| Mid | $0.19 | $7.07 | 2.0% |
| Macro | $0.10 | $4.39 | 1.5% |
| Mega | $0.07 | $5.00 | 1.1% |
Source: OpenSponsorship, same dataset. Medians.
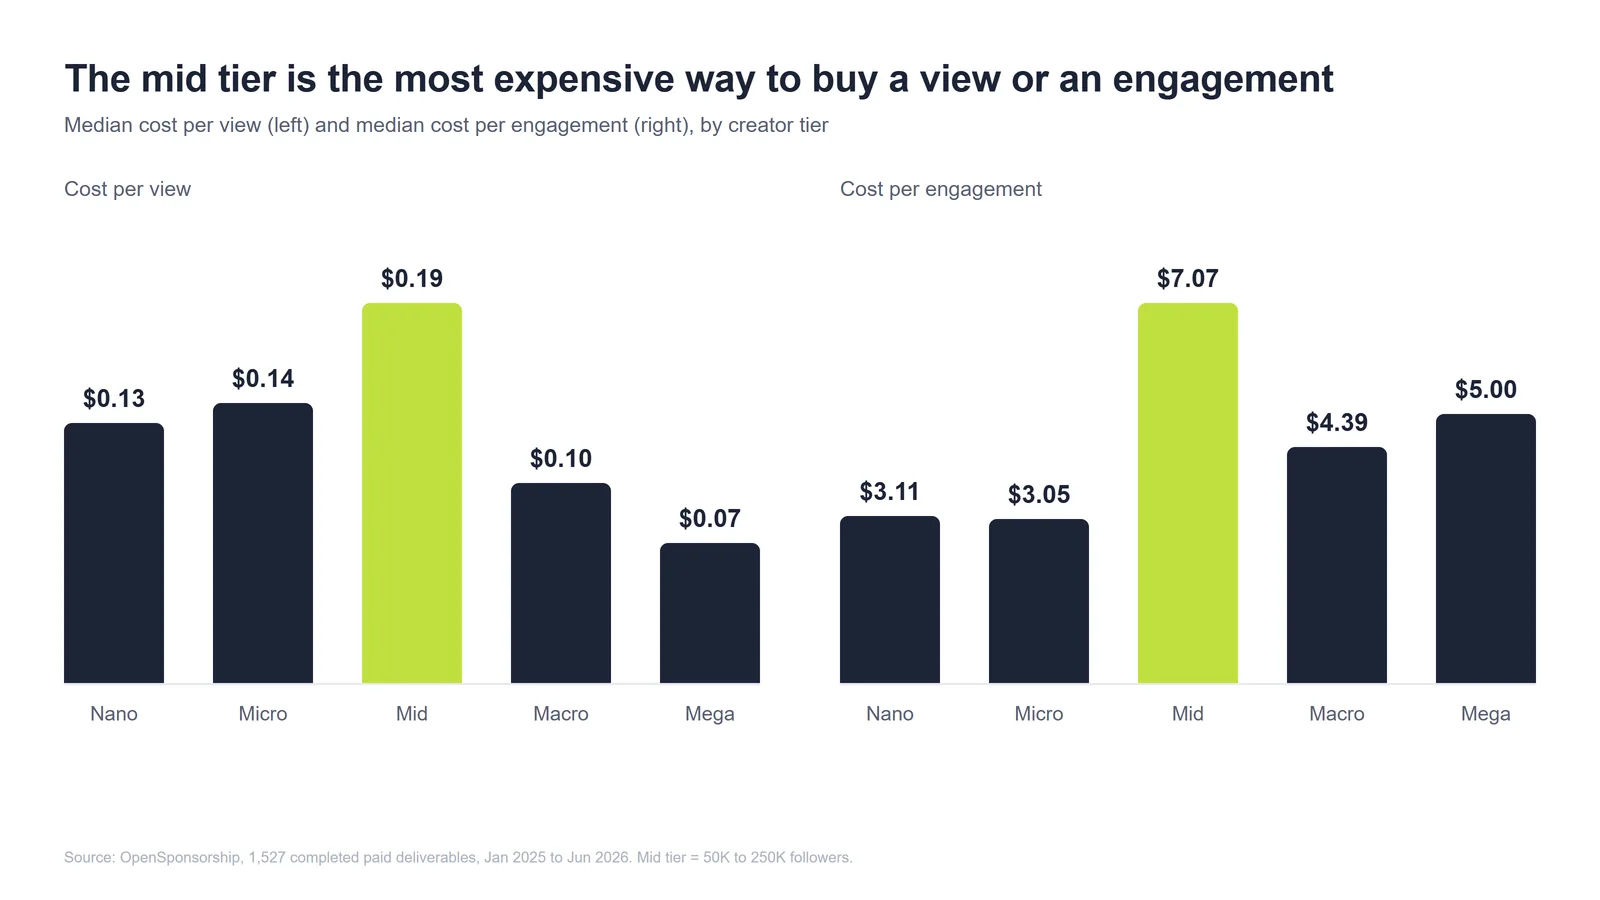
The mid tier is the outlier. Creators with 50K to 250K followers post the highest cost per view ($0.19) and the highest cost per engagement ($7.07) of any tier. By spend band, deliverables under $500 cost a median $0.10 per view, while deliverables over $7,500 cost $0.41 (15 deliverables, so indicative).
Pro tip: match the tier to the goal before comparing prices. Larger creators can offer a lower cost per view, while nano and micro creators show a lower cost per engagement in this dataset. For sign-ups and sales, compare conversion costs separately.
Remember: Audit every mid-tier booking for a specific audience reason.
Why Published Influencer Rate Cards Disagree
Rate cards disagree because they measure different things: survey price ranges, posted asking prices, final payouts, and cash-only transaction medians all circulate under the same tier names.
| Source | Statistic type | What it measures | Period |
|---|---|---|---|
| OpenSponsorship | Median | Cash fee paid per completed deliverable | Jan 2025 to Jun 2026 |
| Collabstr, posted | Average | Creator's posted package price | 2025 |
| Collabstr, payout | Average | Final negotiated payout | 2025 |
| Influencer Marketing Hub | Survey selections | Price ranges respondents chose per tier, with respondent-defined tiers | 2026 |
| Aspire | Average CPM | All platforms, definition not stated | 2025 |
Five conflicts show up when you line the sources up:
- Tier boundaries. impact.com puts nano under 15K and micro at 15K to 75K, while OpenSponsorship puts nano under 10K and micro at 10K to 50K.
- Surveys and transactions. Influencer Marketing Hub respondents place mid-tier creators mostly in the $2,000 to $5,000 and $5,000 to $10,000 bands, about 22.2% each. OpenSponsorship's mid-tier median is $417. No source reconciles the gap.
- CPM. OpenSponsorship's $0.13 per view equals $130 per 1,000 views. Aspire reports an all-platform average CPM of $2.68 for 2025, down 42%, without defining the metric. The two cannot be compared.
- Platform and tier CPM inside one report. Later's 2025 release lists average CPMs of $30.31 for Instagram and $76.97 for TikTok next to a $119 median CPM for micro creators, and it does not reconcile them. We use it as an illustration only.
- Averages and medians. CreatorIQ's compensation data shows the top 10% of creators earned 62% of total payments in 2025, and creators earned an average of $11.4K per campaign while the median creator earned $3K. Averages overstate what a typical creator earns.
This report uses OpenSponsorship's medians for rates and efficiency, and Aspire's CPM only as a year-over-year trend.
Influencer Engagement Rate Benchmarks by Platform, Creator Tier, and Content Format
Engagement by followers is highest on TikTok and lowest on X, and engagement per view is highest for nano creators and lowest for macro creators, but the two sets of figures use different bases and cannot be compared. Engagement figures are comparable only when they share a denominator, and the three datasets below use three different ones: followers, views, and an undefined base.
How Is Influencer Engagement Rate Calculated?
Engagement rate is total engagements divided by a base, most often followers or views, and the base changes the result. A post with 2,000 engagements and 50,000 views from a creator with 20,000 followers scores 4.0% per view and 10% per follower.
| Source | Account type | Base | Engagements counted |
|---|---|---|---|
| Socialinsider | Brand accounts | Followers | Likes, comments, shares, and saves (TikTok); likes and comments (Instagram) |
| OpenSponsorship | Creator campaigns | Views | Likes, comments, shares, and saves |
| Collabstr | Marketplace campaigns | Not stated | Sharing, liking, and commenting |
Brand Account Engagement Rates by Platform
For context, Socialinsider's 2026 benchmark shows how engagement varies across brand accounts. TikTok led in 2025 with a 3.70% follower-based engagement rate, followed by Instagram at 0.48%, Facebook at 0.15%, and X at 0.12%. These figures provide a platform reference rather than a direct benchmark for influencer campaigns.
| Platform | 2024 | 2025 |
|---|---|---|
| TikTok | 2.50% | 3.70% |
| 0.50% | 0.48% | |
| 0.15% | 0.15% | |
| X | 0.15% | 0.12% |
Source: Socialinsider 2026 Social Media Benchmarks, 70M brand posts, January 2024 to December 2025. These are brand-account rates. The same page gives lower TikTok values elsewhere (2.60% in its summary), so the table above is quoted with its year labels.
Engagement Rate Benchmarks by Creator Tier
Nano creators earn 4.6% engagement per view, the highest of any tier, and macro creators the lowest at 2.6%.
- Nano: 4.6%
- Micro: 4.3%
- Mid: 2.9%
- Macro: 2.6%
- Mega: 3.5%, on 53 deliverables
These rates count engagements per view, so they cannot be compared with the follower-based platform table above.
Engagement Rate Benchmarks by Content Format
Based on Collabstr marketplace campaigns, engagement by format is:
- YouTube videos: 6%
- Instagram Reels: 5%
- YouTube Shorts: 4.5%
- Instagram posts: 3.5%
- TikTok videos: 2%
Collabstr does not state a base for these rates. The 2% for TikTok videos and the brand-account rate in the platform table come from different datasets and bases, so they do not conflict.
Sponsored content earns less engagement than organic content in fashion. Traackr's benchmark of 342 fashion brands found organic content ahead of sponsored in the US (1.65% against 1.14%), the UK (2.23% against 1.30%), and France (2.84% against 1.84%). The data is from 2024.
Influencer Content Approval Time: Available Data and Tracking Template
We found no comparable public benchmark for influencer content approval time across the industry reports reviewed. The closest available data comes from Adobe's survey of 1,600+ marketers, which covers marketing content broadly rather than influencer campaigns specifically.
We checked public pages and reports from Aspire, Linqia, Collabstr, CreatorIQ, and Influencer Marketing Hub. The Influencer Marketing Hub report names the cycle from brief to content, approvals, posting, and reuse as a scaling bottleneck, and it publishes no durations.
What Slows Influencer Content Approval?
Adobe's survey shows how complex content approvals can become across marketing teams. While the findings cover marketing content broadly rather than influencer campaigns specifically, they help explain where review delays can arise:
- 89% say content goes through three or more approval stages.
- 58% say more than 40% of their time goes to managing reviews and approvals.
- 47% say a single piece of content involves 51 to 200 people.
- 31% name lengthy manual approvals as a barrier to content production.
Legal and disclosure review is its own stage on creator content, because FTC disclosure rules apply to any post with a material connection to a brand. Our FTC guidelines guide covers what each post has to disclose.
How to Track Influencer Content Approval Time
Track the milestones below for each deliverable to calculate total approval time and identify where delays occur.
| Stage | What to log | Owner | Metric |
|---|---|---|---|
| Brief sent | Date and time sent, creator's confirmation | Brand or agency | Hours to creator acceptance |
| Draft received | Date and time of first draft | Creator | Days from brief to first draft |
| Feedback sent | Date and time of consolidated feedback | Brand | Days to first feedback |
| Revision received | Date and time of each revision | Creator | Days per revision round |
| Legal cleared | Date and time legal review was requested and cleared | Legal or compliance | Days from submission to legal clearance |
| Final approved | Date and time of final content sign-off | Brand or agency | Days from first draft to final approval |
| Scheduled | Date and time the post is queued | Brand | Days from final approval to scheduled post |
Measure total approval time from the moment the first draft arrives until final sign-off. Track feedback, revisions, and legal review separately to see where delays occur. Once enough deliverables are logged, use the median approval time as your internal benchmark.
How to Shorten Influencer Content Approval Time
Five changes cut avoidable waiting, and each one happens before the creator starts filming.
- Write a one-page brief with the message, the must-haves, and the claims to avoid. Our influencer brief templates give you a starting layout.
- Name every approver before kickoff, so no reviewer appears after the first draft.
- Collect all feedback into one consolidated round per draft.
- Pre-clear claims and disclosure wording with legal before the brief goes out.
- Set a cap of two revision rounds in the contract.
Paid Usage Rights Fees for Influencer Content
Paid usage rights fees have no shared market standard. impact.com cites a general 20% to 50% uplift on the base content fee and separately publishes monthly rates by creator tier. Our UGC pricing guide puts 12 months of usage at 30% to 50% above base. We found no dataset that compares duration, channel, and exclusivity fees on the same basis.
What Do Paid Usage Rights Cover?
Paid usage rights allow brands to reuse creator content across their own channels and ads. Running ads from the creator's handle requires additional permissions, which may be included in the same agreement or negotiated separately.
impact.com calls the second mechanism content boosting or allowlisting. Whitelisting and Spark Ads fall into that group, because the ad runs from the creator's handle. Usage rights cover the brand's own handle and owned channels.
Paid usage rights are priced in one of two ways. They can be included in the base rate, which 67% of brands do through the initial contract or rate.
Usage rights can also carry an additional fee. Boosting permissions may be included in the same agreement or priced separately, often as a percentage of ad spend. We cover those fees below.
Paid Usage Rights Fees by Duration
Published fees follow two bases, a flat uplift for the whole term and a monthly rate, and the gap between them grows with the length of the term.
| Model | Basis | 1 month | 3 months | 12 months | Perpetual | Applies to |
|---|---|---|---|---|---|---|
| A: inBeat usage rights guide | Flat uplift on base rate for the whole term | Not listed | +20% to 30% | +30% to 50% | +100% to 150% | UGC content, $212 average base rate |
| B: impact.com | Monthly rate varies by creator tier | See tier-specific rates below | Negotiated; no fixed rate | Not specified | Premium; no published figure | Influencer content licensed for brand reuse |
Sources: inBeat usage rights guide (6 months: +25% to 40%) and impact.com. impact.com's example: a $500 base, a monthly usage fee of 50% of base, 3 months equals $750.
The impact.com figures illustrate monthly pricing rather than fixed fees for longer contracts. Actual 12-month rates depend on the negotiated terms, while the perpetual range in Model A comes from inBeat's own pricing guide.
Platforms set their own limits on duration. TikTok lets the creator choose a Spark Ads authorization window of 7, 30, 60, or 365 days. Meta's partnership ads help page states no fixed duration, and creators can revoke permission at any time.
Paid Usage Rights Fees by Creator Tier
impact.com's monthly paid usage rights fees rise with creator tier, from 0% to 50% of base for nano creators to 100% or more for celebrity creators.
| Tier (impact.com definition) | Monthly fee as share of base rate |
|---|---|
| Nano, under 15K followers | 0% to 50% |
| Micro, 15K to 75K | 25% to 75% |
| Mid, 75K to 250K | 40% to 100% |
| Macro, 250K to 1M | 50% to 125% |
| Celebrity, 1M and above | 100% and above |
Source: impact.com. These are indicative monthly usage-rights ranges by creator tier. Its broader 20% to 50% guidance refers to an additional usage-rights fee rather than a universal monthly rate.
How Much Do Creators Charge for Whitelisting and Spark Ads Boosts?
Creators typically charge 5% to 20% of the ad spend behind a boosted post, according to impact.com.
Boost fees may be charged separately from paid usage rights, depending on the agreement. Our TikTok Spark Ads guide covers the setup and the metrics that matter for these campaigns.
Exclusivity Fees for Influencer Contracts
impact.com gives an indicative exclusivity fee of 20% to 100% of the base rate, depending on the restriction period and brand size. Its example prices three months of exclusivity at 50% of base.
Their stacked example shows how the lines add up for one Instagram post:
- Base rate: $500
- Three months of usage rights: $750
- Website use: $200
- Boost fee (15% of a $300 spend): $45
- Three months of exclusivity: $250
- Total: $1,745
How to Evaluate a Paid Usage Rights Quote
Ask for eight terms in writing before you compare any two quotes:
- Pricing basis, monthly or flat for the term
- Duration, including renewal terms
- Channels covered, such as the brand's handle, website, and email
- Whose handle runs the ad
- Edit rights over the content
- Spend cap on boosted posts
- Exclusivity scope and end date
- Whether the fee applies to the base rate or to a bundled production fee
Brands buy these rights widely: 77% of brands repurpose creator content in paid ads, and 7.56% of Influencer Marketing Hub respondents name licensing, whitelisting, or Spark Ads a focus area for 2026. Perceived impact is low: only 5% rank whitelisting as highly effective, the lowest rating of any format in that survey.
Meta reports that partnership ads deliver 19% lower CPAs and 13% higher click-through rates on average than business as usual campaigns. The footnote with the method is not visible on Meta's page, so treat it as Meta's own claim.
Influencer Marketing Budget Statistics for 2026
87.49% of marketers expect to raise their influencer budget in 2026 and 5.55% expect to cut it, according to Influencer Marketing Hub's 2026 survey, with 72.22% planning an increase of 50% or more.
| Statistic | Value | Source | Sample | Period |
|---|---|---|---|---|
| Expect higher budgets | 87.49% | Influencer Marketing Hub | 600+ marketers, among those answering | 2026 |
| Plan to increase | 74% | Aspire | Nearly 900 marketers and creators | 2026 report |
| Expect to raise budgets | 89% | Kolsquare | 1,123 European decision-makers | May to Jun 2026 |
| Increasing budgets | 62% | Linqia | 200+ enterprise marketers | Published Sep 2025 |
| Investment increased year over year | 66% | CreatorIQ | 2,000 brands and agencies in 9 countries | Jul to Aug 2026 |
Spend levels, each on its own base:
- Brands allocated an average of 23% of total marketing budgets to creator partnerships in 2025.
- The average annual creator investment reached $4.8M, up 33%, with enterprise at $8.8M.
- 60% of European organizations spend more than EUR 100,000 a year, and the median is EUR 144,000.
- About a third of surveyed Linqia enterprise marketers plan to spend more than $5M.
Market size depends on the definition. eMarketer forecasts US influencer marketing spend at $10.5B in 2025 and $13.7B by 2027. IAB projects US creator ad spend at $37B in 2025, up 26%, and $44B in 2026. They measure different things.
We left out the widely repeated "$5.78 per $1" return because we could not trace it to a primary source. For a method that proves return, see our influencer marketing ROI guide.
Influencer Platform and Social Commerce Statistics for 2026
Instagram is the most used platform in Europe at 90.6%, and TikTok is the platform marketers name most in their 2026 influencer plans at 31%. Both can be true, because the surveys ask different questions.
| Source | Question measured | Population | TikTok | Period | |
|---|---|---|---|---|---|
| Influencer Marketing Hub | Platform included in influencer plans | 600+ marketers | 31% | 8% to 15% range for every other platform | 2026 |
| Kolsquare | Platforms used | 1,123 European decision-makers | 66.5% (down 12.5 points) | 90.6% | May to Jun 2026 |
| CreatorIQ | Platform use by CreatorIQ customers | Customer data | 93% | 99% | Aug 2025 to Jul 2026 |
Read Influencer Marketing Hub as the place plans concentrate, and Kolsquare and CreatorIQ as the place activity sits. CreatorIQ also reports that organizations use four to five platforms on average. Inside the Influencer Marketing Hub data, TikTok accounts for 32% of platform selections among budget increasers and 39% among reducers, while Instagram accounts for 20% and 6%.
Social commerce is still early:
- 53.33% of respondents do not use social commerce and 46.67% plan to test it in 2026.
- TikTok Shop takes 66.17% of platform selections among adopters, ahead of Instagram Checkout (13.16%), YouTube Shopping (9.02%), and Facebook Shops (8.27%).
- 70.37% of budget increasers use social commerce, against 41.67% of budget decreasers.
- 32% of brands sell through TikTok Shop, up from 17%.
Creator Tier Mix and Content Format Statistics for 2026
Brands plan to expand nano and micro work most: 51.43% of respondents plan to grow nano use and 52.83% micro use, while macro sits flat at 20.59% expanding and 20.58% contracting.
| Tier | Expansion intent | Contraction intent |
|---|---|---|
| Nano | 51.43% | 10.00% |
| Micro | 52.83% | 7.55% |
| UGC | 50.00% | 0% |
| Mid | 42.42% | 21.21% |
| Macro | 20.59% | 20.58% |
| Celebrity | 33.33% | 0% |
Source: Influencer Marketing Hub, 2026, among those answering each tier question.
- Aspire reports that 27% of marketers work primarily with nano creators and 27% with micro, and 32% invest in mid-tier creators.
- In Europe, micro creators are used by 70.9%, macro by 59.7%, nano by 30.5%, and mega by 24.6%. 36.8% work with 100 or more creators.
- Long-form video ranks in the top three formats for 83% of respondents, short-form video for 80%, and live shopping for 62%. UGC is rated highly effective by 31%, static content by 25%, and Stories by 14%.
- 99% of brands repurpose creator content, and 69% of marketers in Aspire's report say influencer-generated content performs better than brand-directed content.
KPI, Payback, and Measurement Statistics for Influencer Marketing
Brand awareness is the KPI most budget increasers select, at 89%, and 65.9% of marketers expect payback within one month.
- 65.9% expect payback within one month, and 48.4% within two weeks. Several payback cohorts in that survey rest on small bases.
- Among budget increasers, 89% select awareness, 51% engagement, 39% content quality, 35% conversions, 25% attributable revenue, 20% web traffic, and 18% reach.
- Promo codes lead measurement tools at 45.9%, ahead of affiliate links (26.0%) and native shop features (25.0%). Upper-funnel KPIs make up 69.2% of the mix for the +50% group and 45.5% for flat budgets.
Other surveys use their own bases.
- Engagement rate is the most-used KPI in Europe at 37.2%, yet only 41% of marketers are extremely confident measuring it.
- 40% of buyers rank overall ROI as their top KPI.
- 77% of brands feel confident measuring business impact, but no single method exceeds 19%.
Influencer Marketing Hub respondents select several KPIs, while IAB asks for one top KPI, so awareness at 89% and ROI at 40% do not conflict.
Measurement as a challenge appears on two bases:
- ROI measurement is 8.70% and attribution complexity 7.14% of reported challenges in the Influencer Marketing Hub survey, which counts each answer as a share of all selections.
- 79% of enterprise marketers cite ROI as their biggest challenge in Linqia's survey, which counts a share of respondents.
In a Meta-commissioned Ipsos survey of 34,015 respondents across 10 countries, 71% reported making a purchase within a couple of days of seeing creator content on Meta's platforms. The figure reflects reported purchasing behavior rather than measured incremental sales.
Influencer Fraud Statistics for 2026
Fake or bot followers account for 56.5% of the fraud and quality issues marketers report, more than every other category combined.
- Fake or bot followers: 56.5% of reported issues.
- Templated or inauthentic comments: 10.6%.
- Purchased engagement: 10.2%.
- Undisclosed or incentivized reviews: 6.1%.
- Misreported performance metrics: 5.4%.
- None of the above: 10.9%.
Fake engagement and authenticity problems also make up 12.73% of reported challenges. All figures come from respondents answering the Influencer Marketing Hub fraud question.
AI Adoption Statistics in Influencer Marketing for 2026
Creator discovery is the most common use of AI in influencer marketing at 36.67% of selections, and 10.56% of respondents report using no AI at all.
- Creator discovery: 36.67%
- Content generation: 21.11%
- Brief development: 13.89%
- Reporting: 10.56%
- Fraud detection: 7.22%
- Not using AI: 10.56%
The surveys differ on the broader picture. 59% of marketers use AI in their influencer operations in Aspire's report, and 84% of European organizations use AI or automation, with audience analysis and fraud detection the top use at 62.1%.
The two fraud figures cannot be compared: Kolsquare combines audience analysis with fraud detection in one category, while the Influencer Marketing Hub 7.22% is a share of all AI selections. Our guide to AI in influencer marketing covers tools and strategies.
In-House vs Agency Influencer Marketing Statistics
In-house management means different things across surveys. Linqia reports that 23% of enterprise marketers manage influencer programs in-house, while Kolsquare finds that 77% of European brands retain some internal involvement, often with agency support.
| Source | Population | In-house | Hybrid or agency-supported | Fully agency |
|---|---|---|---|---|
| Influencer Marketing Hub | Marketers, 2026 | 66.33% | 10.71% hybrid | 10.71% (12.24% do not run influencer marketing) |
| Linqia | Enterprise marketers, published 2025 | 23% | 49% partner with specialist agencies, up from 28% | Not listed |
| Kolsquare | European brands and agencies, 2026 | 77% in some form | Agency-supported is the top model at 25% | 23%, up from 10% |
These figures reflect different populations and operating models. Kolsquare includes agency-supported teams in its 77% figure, while Linqia measures in-house management. They should not be treated as directly comparable.
Brands that use agencies buy specific functions. Influencer Marketing Hub respondents outsource creator discovery and vetting most often (19.44%), then content production (15.28%), and reporting and analytics least (6.9%). Our comparison of in-house and outsourced influencer marketing covers the trade-offs.
How to Use Influencer Marketing Benchmarks to Set a Campaign Budget
Start from the tier medians for the base rate, then add each fee line from a written quote and compare it against the benchmark in the table below.
- List the deliverables and the creator tier for each one.
- Price each base rate at the tier median from the cost section.
- Add paid usage rights, boost, and exclusivity lines from written quotes.
- Compare every quote line against the benchmark and the red flag below.
- Log approval time for each deliverable and use your own median next quarter.
A worked example: ten micro deliverables at the $150 median cost $1,500, and two mid-tier deliverables at $417 cost $834, for a base budget of $2,334.
Adding three months of paid usage rights increases the base budget by roughly $470 to $700 under Model A. Using impact.com's tier-specific monthly rates for an illustrative Model B calculation, the additional cost ranges from about $2,100 to $5,900. Actual three-month fees depend on negotiated terms.
The example applies percentages published for different content types to OpenSponsorship medians, so it shows the spread and does not forecast a cost.
| Quote line | Benchmark | Red flag |
|---|---|---|
| Base rate | Tier median, $134 (nano) to $2,727 (mega) | Far above the tier median with no stated audience reason |
| Platform rate | Average payout on Collabstr, such as $193 on Instagram | Quote exceeds comparable platform deals without a clear audience or deliverable reason. |
| Cost per engagement | $3.05 to $3.11 for micro and nano, $7.07 for mid | CPE exceeds comparable creators in the same niche without a clear audience or performance advantage. |
| Paid usage rights | +20% to 30% for 3 months (Model A); tier-specific monthly rates (Model B) | The quote does not state its basis |
| Boost fee | 5% to 20% of ad spend | Above 20% of ad spend without additional rights or a clear pricing rationale. |
| Exclusivity | 50% of base for three months (impact.com example) | No end date or competitor list |
Influencer Marketing Benchmark Methodology: Sources and Limits
This report combines more than a dozen sources, and each carries its own sample, period, and skew.
| Source | Sample | Period | Known limit |
|---|---|---|---|
| OpenSponsorship | 1,527 paid deliverables | Jan 2025 to Jun 2026 | Skews to sports, wellness, food, lifestyle; mega tier n=53 |
| Collabstr | 472,000+ packages, 21,000+ collaborations | 2025 | Marketplace data; engagement base not stated |
| Aspire | Nearly 900 marketers and creators | 2026 report | Full report gated; CPM definition not stated |
| Socialinsider | 70M brand posts | 2024 and 2025 | Brand accounts, not creators |
| Influencer Marketing Hub | 600+ marketers | 2026 | Intent, not outcome; multi-select; small bases in some cohorts |
| impact.com | Staff interviews | Apr 2025 | Practitioner guidance, no sample size |
| Adobe | 1,600+ marketers | 2025 | All marketing content |
| Kolsquare | 1,123 European decision-makers | May to Jun 2026 | Europe only; brands and agencies |
| CreatorIQ | 2,000 brands and agencies | Jul to Aug 2026 | Platform use is customer data |
| Linqia | 200+ enterprise marketers | Autumn 2025 | Enterprise only; about a year old |
Many "2026" reports describe 2025 activity. Linqia's 2026 report was published in autumn 2025, Traackr's 2025 fashion benchmark uses 2024 data, and Aspire and Collabstr describe 2025 results.
IAB, eMarketer, Traackr, Later, TikTok, and Meta appear once or twice and are labeled where used. Figures we could not confirm on the publisher's own page were left out.
Build a Benchmark-Led Creator Program With inBeat
A benchmark tells you what a quote looks like across the market. A creator program tells you which quotes earn a second booking. We run both together, from creator sourcing to paid usage terms to the measurement that decides the next brief.
Book a strategy call and we will go through your current creator quotes, your usage terms, and how to measure what comes back.
Influencer Marketing Benchmark FAQs
Does a paid usage rights fee apply to the base rate or to the total fee including production?
Published guidance applies the fee to the base rate for the content itself. If a quote bundles production, editing, or raw files into one fee, ask which part the percentage touches before you compare it with another quote.
How should a brand set an engagement benchmark when views per follower differ by creator size?
Use engagement per view as the base when you compare creators of different size. Views per follower fall from 19.9% for nano creators to 1.1% for mega creators, so a follower-based rate flatters small accounts.
Can a brand apply these median rates to a niche such as health, finance, or B2B?
Treat the medians as a starting reference and add the stages your category requires, such as legal review and tighter usage terms. The OpenSponsorship dataset skews toward sports, wellness, food, and lifestyle, so test the medians against two or three quotes in your own category first.
When a creator's rate is already below the tier median, should the paid usage rights fee still be a full percentage of base?
The percentage applies to the creator's own base rate, so a low rate produces a low dollar fee. Compare the dollar amount, because the percentage hides the base. Confirm the pricing basis too, monthly or flat for the term.
How does approval time change for regulated categories such as health and finance?
The reports reviewed provide no comparable approval-time benchmark for regulated categories. Health and finance campaigns may require additional legal or compliance review, which brands can track separately using the framework above. Our UGC compliance guide covers the requirements and review process for healthcare content.