
Health creators now sit between a brand and its customer at almost every step: where people hear about a supplement, how they judge a telehealth subscription, and which health app they download.
The numbers below show what that channel delivers in 2026, what it costs, and where the benchmarks used for other categories mislead health brands.
Every figure is health-specific; for cross-industry creator rates and engagement, see our influencer marketing benchmark report.
Key Healthcare Influencer Marketing Statistics for 2026
| Benchmark | Figure | Source |
|---|---|---|
| Median TikTok engagement, nano health creators | 0.94%, lowest of 20 industries | IQFluence, 2026 |
| Health and wellness brand engagement by views | 2.5% TikTok, 2.3% Instagram | Dash Social, 2026 |
| Average healthcare creator fee per sponsored post | $175 | Collabstr |
| TikTok Shop US health and beauty sales growth | 84% year over year, $4.4B | NielsenIQ |
| US adults who get health information from influencers or podcasts | 40% | Pew Research Center |
| Health influencer posts that promote a product or service | 38% | Pew Research Center |
| Posts about supplements and OTC medications that promote | 66% | Pew Research Center |
| Health influencers with an Instagram account | 86% | Pew Research Center |
Health Influencer Engagement Rate Benchmarks by Platform and Creator Tier
Health creators earn lower engagement rates than creators in most other categories, so cross-industry benchmarks overstate what a health campaign should expect. Measured by followers, health and wellness sits at or near the bottom of every platform and tier.
- Health and wellness creators post the lowest median engagement of the 20 industries IQFluence tracks on TikTok's nano tier: a 0.94% median engagement rate across 28,121 creators with 1,000 to 10,000 followers, measured in September 2026.
- On Instagram, nano health creators reach a median of 1.16% and micro creators 0.40%, against 2.79% and 0.97% for all active creators in the same tiers, per the same IQFluence benchmark of 141.7 million creators.
- A health creator lands in the top quartile of its peers at 1.27% on Instagram's micro tier, 1.03% on TikTok's micro tier and 0.39% on YouTube's micro tier, in the same IQFluence data, where engagement is likes and comments divided by followers.
- Health and wellness brand accounts average 2.5% engagement by views on TikTok and 2.3% on Instagram, per Dash Social's January-June 2026 benchmark. The broader study covered 1,343 TikTok and 3,313 Instagram handles across industries; those totals are not the health and wellness sample size.
- The Instagram figure trails the 2.6% all-industry average and food and beverage at 3.2%, and the TikTok figure trails CPG at 3.1% and food and beverage at 3.5%, in the same Dash Social benchmark.
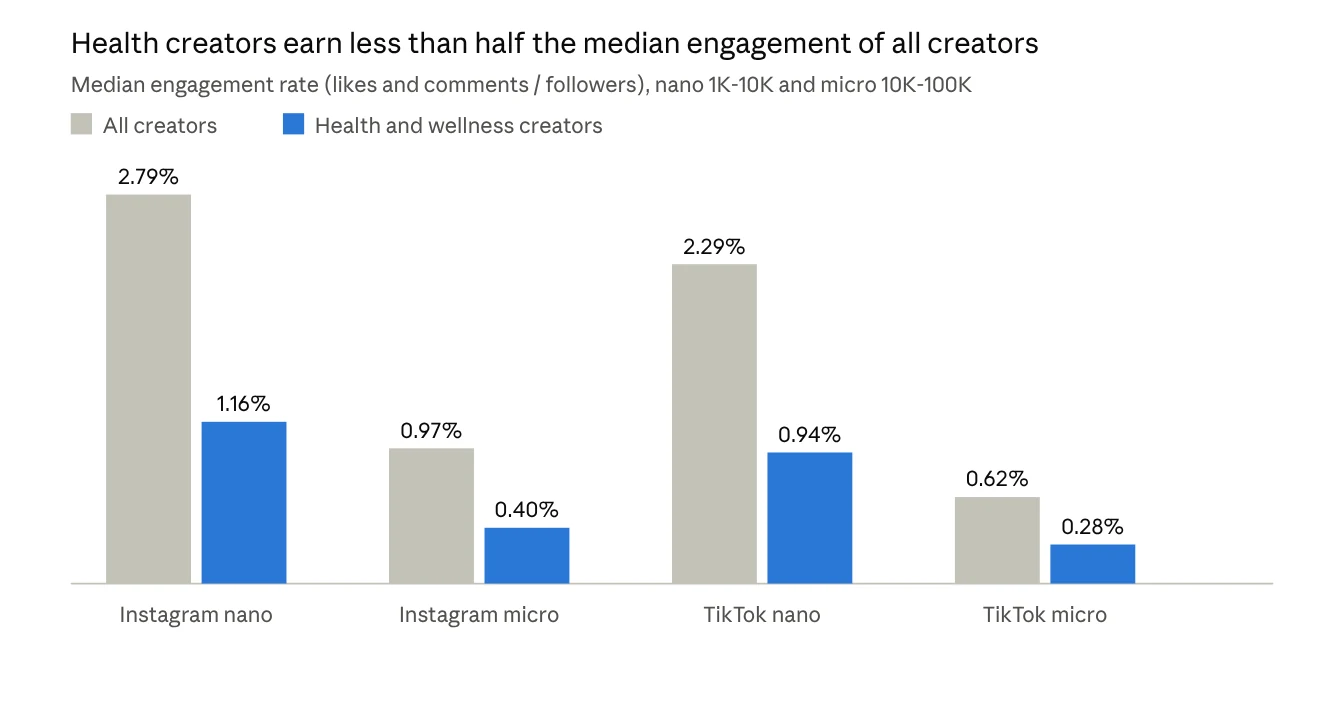
What this means: The two sets of numbers measure different things, which explains why one looks weak and the other healthy. IQFluence divides likes and comments by followers for every active creator account, while Dash Social divides engagement by views for brand accounts, which counts the people the algorithm actually showed a post to. Compare a health creator's follower-based engagement with IQFluence's health medians and p75 line. Dash Social's figures provide context for brand-account content, but its dataset excludes paid ads. In our healthcare UGC work, we evaluate paid placements against our own campaign baselines and conversion results.
Our paid media team's 2026 reference data puts median link CTR at 0.80% for telehealth and 1.18% for consumer health. Link CTR measures link clicks relative to impressions, so it should sit alongside the organic engagement figures above.
Health and Wellness Influencer Rates per Post by Platform and Tier
Health creators charge more than their engagement rates would suggest, and credentials raise the price further. Published rates for the category range from under $200 for a marketplace post to $10,000 for a creator with more than a million followers.
- Healthcare creators on Collabstr's marketplace charge an average of $175 per sponsored post, based on live rates from the platform's pool of more than 1.4 million rate data points.
- IQFluence's healthcare guide prices health micro-influencers at $300 to $500 per post or video, mid-tier creators at $1,000 to $2,500 and creators with more than a million followers at $5,000 to $10,000.
- Credentialed micro creators cost $1,500 to $5,000 per post against $300 to $1,500 for wellness micro creators, in the same IQFluence guide, which attributes the gap to clinical review and the risk attached to a professional's name.
- In a Q1 2026 sleep-supplement test reported in the same IQFluence guide, registered dietitians averaged $1,200 per post and a 1.4% conversion rate, while holistic wellness creators averaged $550 and 0.9%; the cheaper cohort produced more total revenue on higher volume.
- LaunchPoint's rate guide prices micro health and wellness creators at $400 to $1,200 for an Instagram educational Reel, $300 to $800 for a TikTok routine video and $800 to $2,500 for a 60 to 90 second YouTube integration.
- A registered dietitian typically costs 40% to 60% more than a wellness creator with the same follower count, per the same LaunchPoint guide.
What this means: The figures disagree for identifiable reasons. Collabstr averages self-listed rates across every follower size, including many nano and UGC sellers, so its $175 sits below the tier-based bands IQFluence and LaunchPoint publish. The credential premium also varies: LaunchPoint's 40% to 60% is a typical range, while the IQFluence test paid dietitians 118% more per post, a single campaign's negotiated fees. Plan budgets from tier bands, then price credentials separately. Our breakdown of what content creators cost covers usage rights and whitelisting fees.
Healthcare Paid Media Benchmarks: inBeat's 2026 Data
Organic engagement tells us how people respond to a creator. Paid distribution adds a different question: what does it cost to turn that attention into traffic?
Our paid media team's benchmark workbook gives us a closer view of that part of the campaign.
The figures below are reported medians, split between the team's reference brands and inBeat-managed brands. The 2026 period runs from January 1 to November 5; comparisons use the full 2025 calendar year. These paid media results do not isolate influencer campaigns or the effect of creator content.
Telehealth and Consumer Health Need Different Paid Budgets
Across six reference brands in each category, the 2026 all-region median CPM was $21.53 for telehealth, mental health and health tech, versus $12.90 for consumer health, supplements and wellness. Median link CPC was $2.73 versus $0.94, while link CTR was 0.80% versus 1.18%.
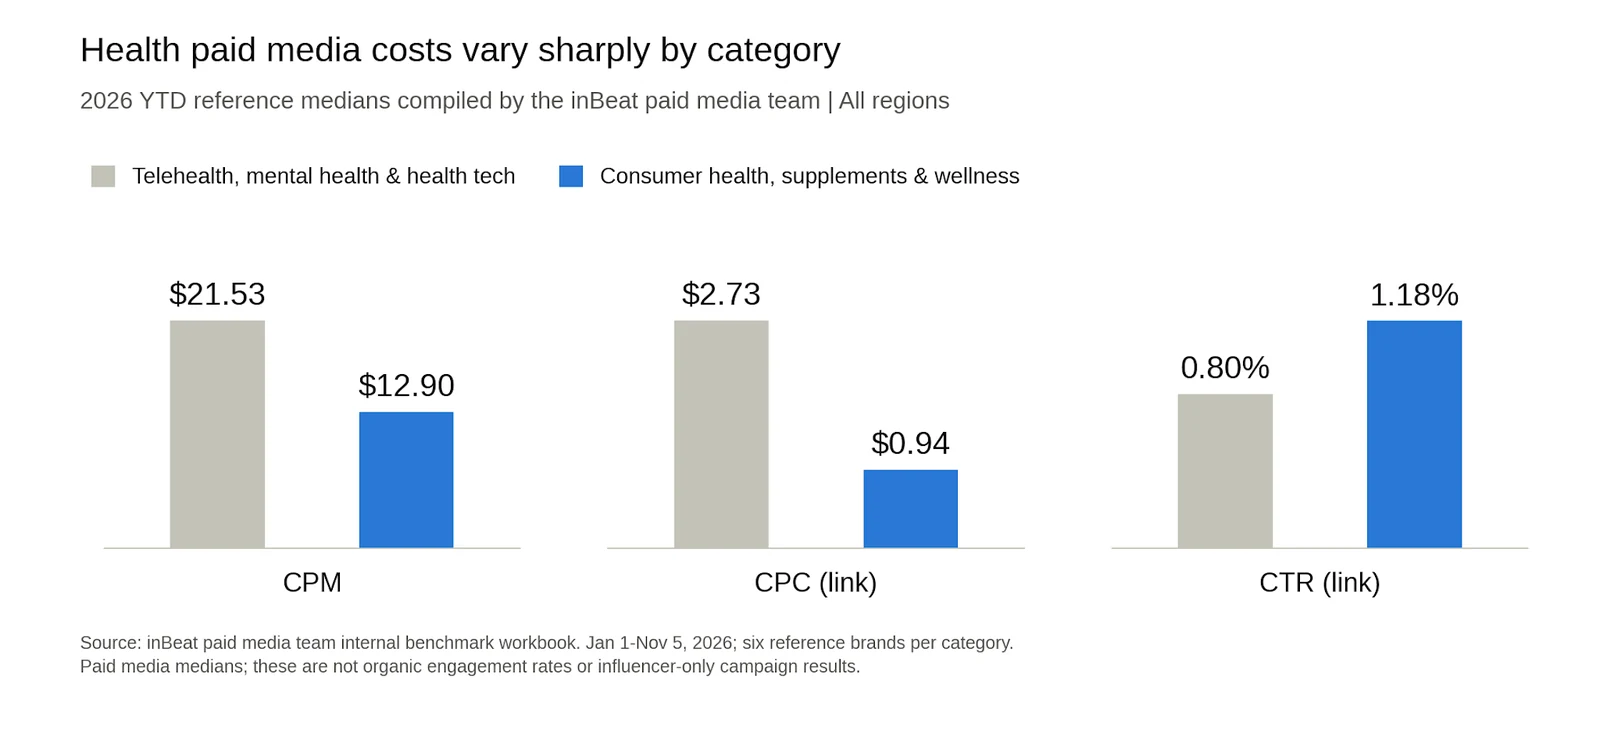
That means a supplement brand's traffic costs are a poor default for a telehealth launch. Start with the relevant category, then check the market, offer and conversion event before setting a target.
inBeat Telehealth: Lower Click Costs and Stronger Link CTR
Our own telehealth data shows that higher auction costs do not automatically mean higher click costs. The team's reference median CPM rose from $18.82 in 2025 to $21.53 in 2026 YTD. Over those reporting periods, inBeat's median link CPC fell from $2.88 to $2.64, while link CTR rose from 0.67% to 0.84%.
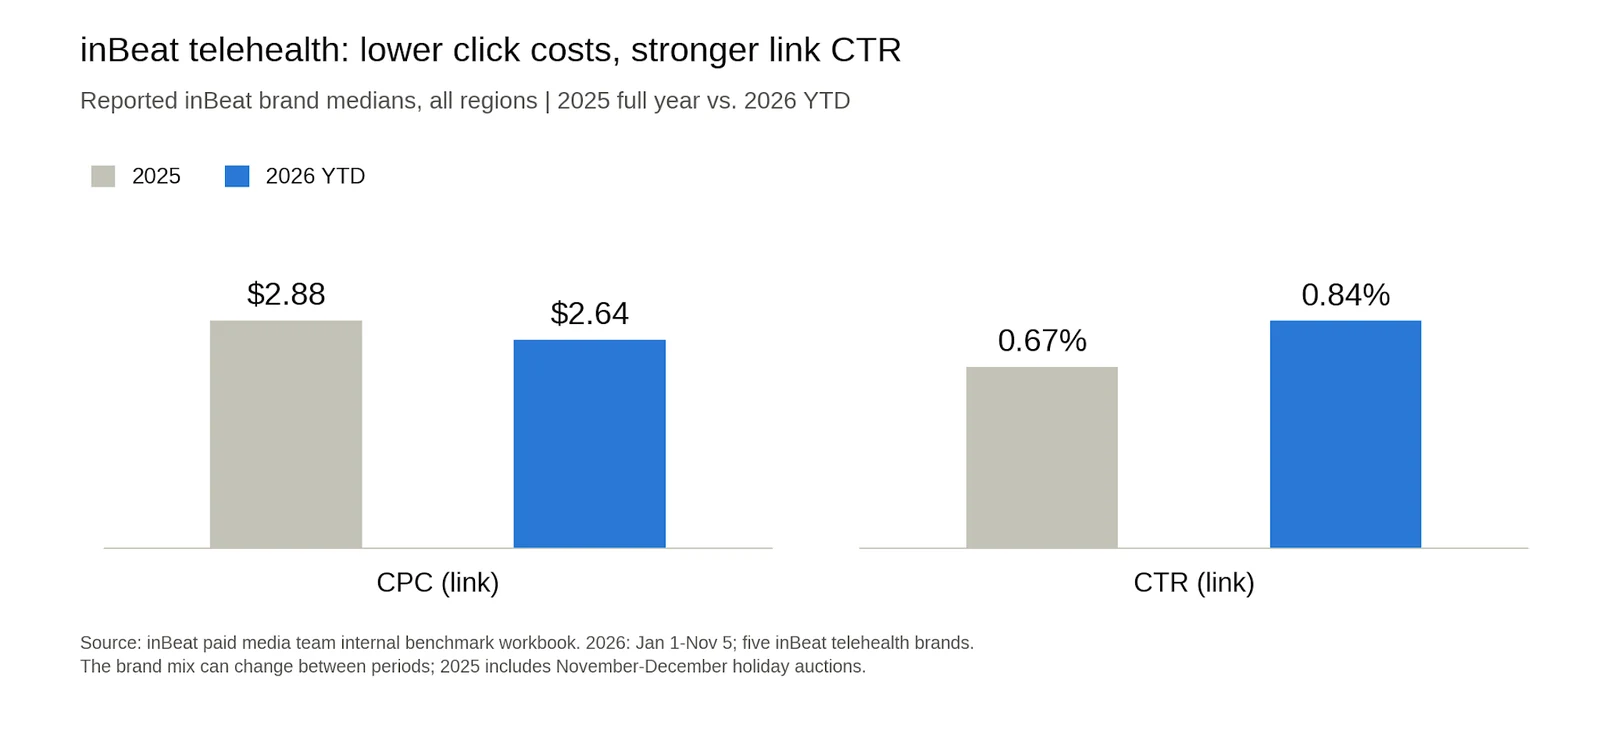
We use that combination to keep the auction and the ad's response separate. A rising CPM tells us impressions cost more; link CTR and CPC tell us whether traffic became harder to earn. The 2026 inBeat figures cover five brands, and the brand mix can change between years, so this is a portfolio comparison.
inBeat Consumer Health: CPM and CPC Moved in the Right Direction
The consumer health comparison gives us another useful signal. In the reported inBeat slice, median CPM fell from $19.03 in 2025 to $14.78 in 2026 YTD, and link CPC fell from $3.64 to $1.95. Link CTR rose from 0.52% to 0.76%, an increase of 0.24 percentage points.
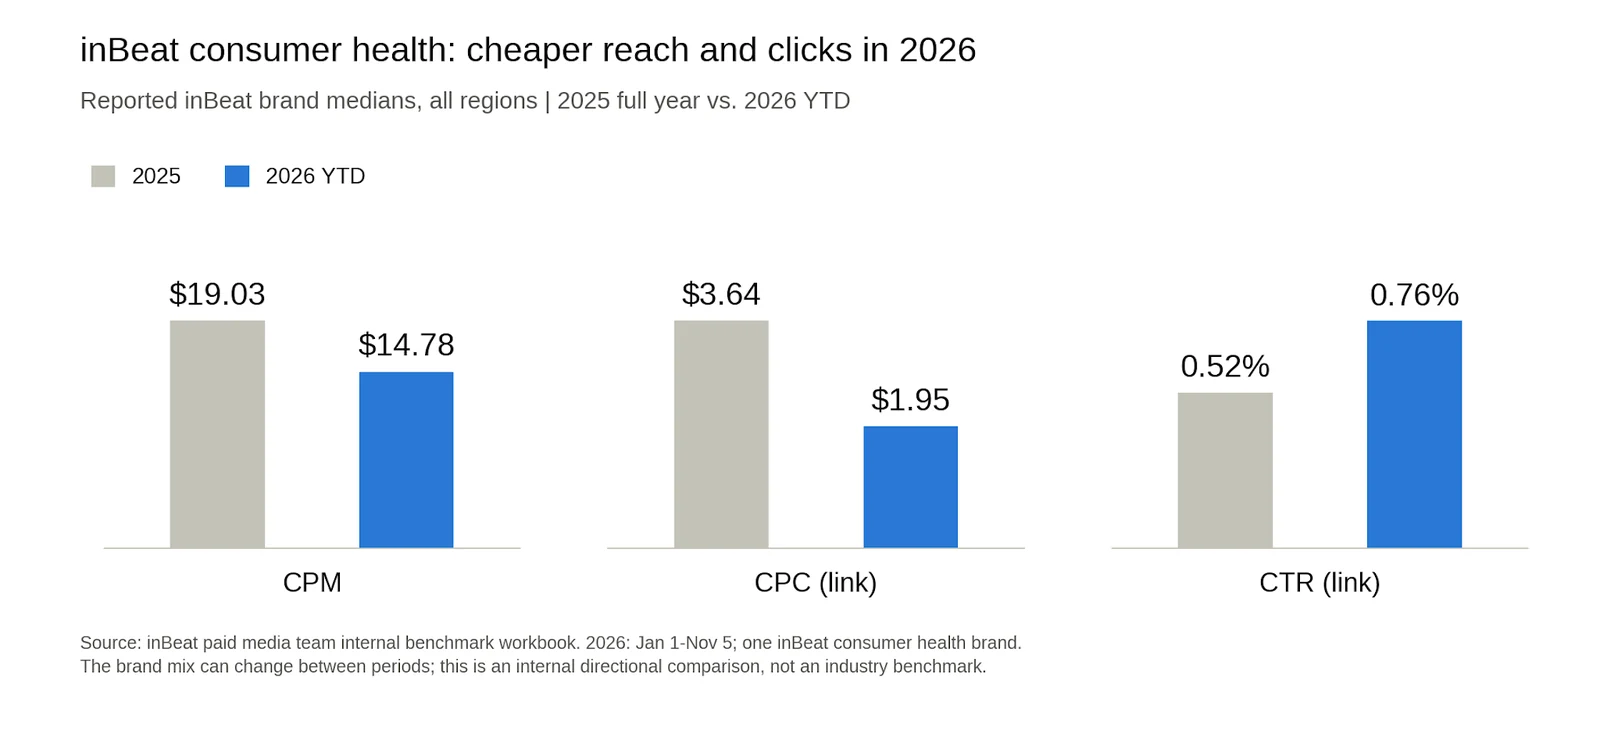
That is roughly 22% lower CPM and 46% lower CPC, calculated from the displayed values. The 2026 sample contains one inBeat brand, so we treat it as a result from our own work. Still, it is a reason to keep testing when category-level media costs rise.
Health and Wellness Influencer Marketing Sales Benchmarks: Supplements and Social Commerce
No independent study yet publishes a return-on-spend ratio for health creator programs specifically. The closest measured outcome is sales on creator-led commerce platforms, where supplements now lead the health category.
Our own paid media data adds an acquisition-cost lens: the 2026 inBeat telehealth slice records a $134.99 median CPA. The conversion event differs by brand, so this is cost per tracked conversion. It is also not a measure of influencer ROAS.
- TikTok Shop's US health and beauty sales grew 84% year over year to more than $4.4 billion, ranking it the fourth-largest US health and beauty ecommerce retailer, per NielsenIQ.
- Nearly 10% of US households shop TikTok Shop, spending $118 a year across three to four purchases, in the same NielsenIQ data.
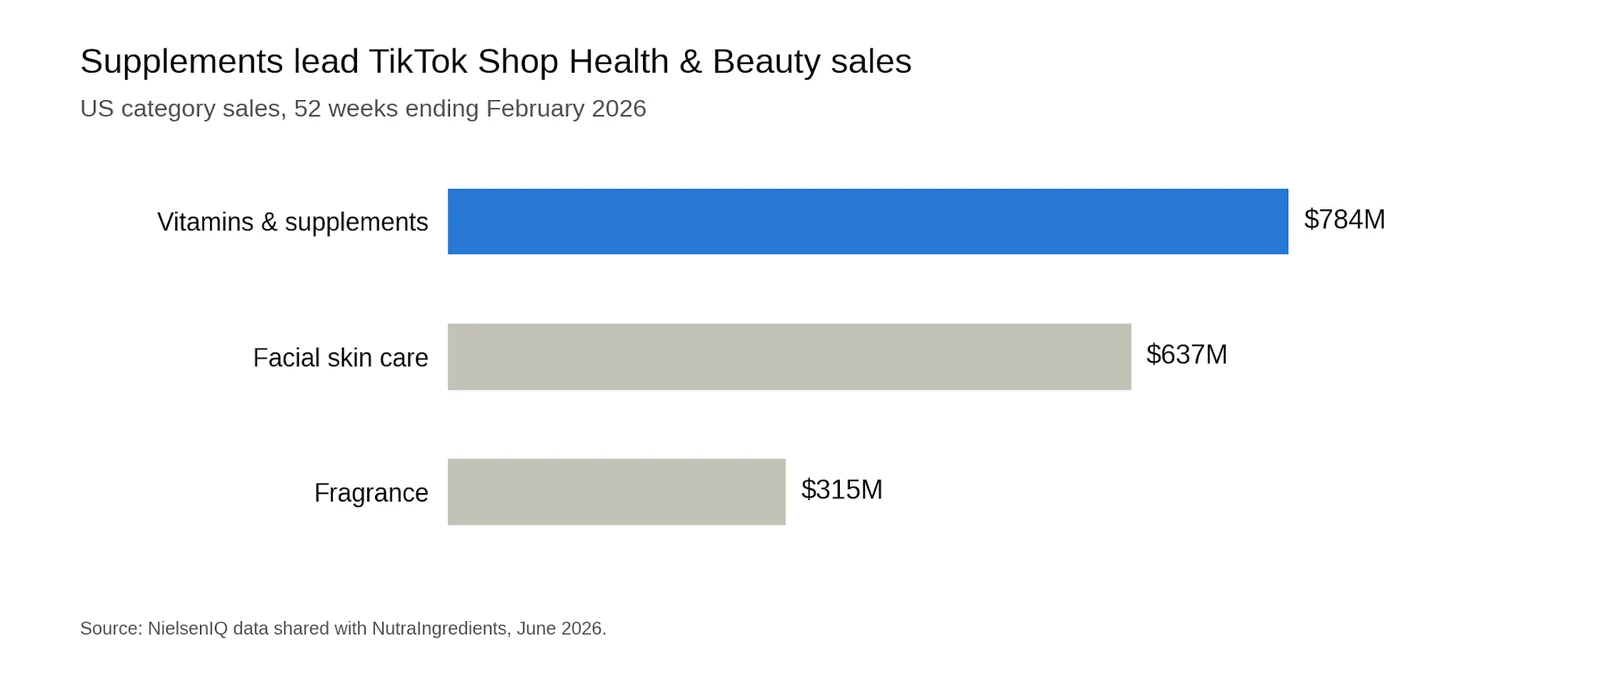
- Vitamins and supplements are TikTok Shop's largest health and beauty subcategory at $784 million in sales for the 52 weeks to February 2026, ahead of facial skin care at $637 million, per NIQ data reported by NutraIngredients.
- eMarketer reports the same retailer's category dollar sales up 107.7% year-over-year, also citing NIQ, and notes that 35% of US adults had used TikTok Shop by March 2026, per a CivicScience survey.
- Gen Z and millennials make up 36% of US adults but drive more than 41% of annual wellness spending, per McKinsey's 2025 Future of Wellness survey of more than 9,000 consumers.
- The segment McKinsey calls "maximalist optimizers" accounts for about 25% of wellness consumers and more than 40% of wellness spend, and it is more likely than any other segment to be influenced by social media, per the same McKinsey survey.
What this means: The two TikTok Shop growth figures both trace to NIQ but likely cover different windows or category cuts; NIQ's own infographic gives 84% for the 52 weeks to February 2026, while eMarketer cites NIQ for 107.7% without stating the period, so the gap most likely reflects a different time window or category scope. Either way, supplement sales on the platform run mostly through creator content. For brands selling there, our TikTok Shop creator affiliate strategy covers commission structures.
Health Influencer Audience Statistics: Who Follows Health Creators and Why
Between three and six in ten US adults get health information from social media, depending on how a survey asks the question. Most of them come across the content while scrolling, and fewer go looking for it.
- Some 40% of US adults ever get health and wellness information from social media influencers or podcasts, and 67% of them say they mostly come across it, double the share who go looking, per Pew Research Center surveys of more than 5,000 adults.
- A desire to change their health or lifestyle is a major reason for 41% of these consumers, and 18% say what they hear from influencers is extremely or very different from what their healthcare providers tell them, per the same Pew survey.
- Asked about frequency, 36% of Americans get health information from social media at least sometimes, and 47% of them rate it not too or not at all accurate, against 7% who rate it highly accurate, per Pew's October 2025 survey.
- KFF finds 31% of adults use social media at least monthly for health information and 60% use it at all; among users, 36% call learning from people with the same condition a major reason.
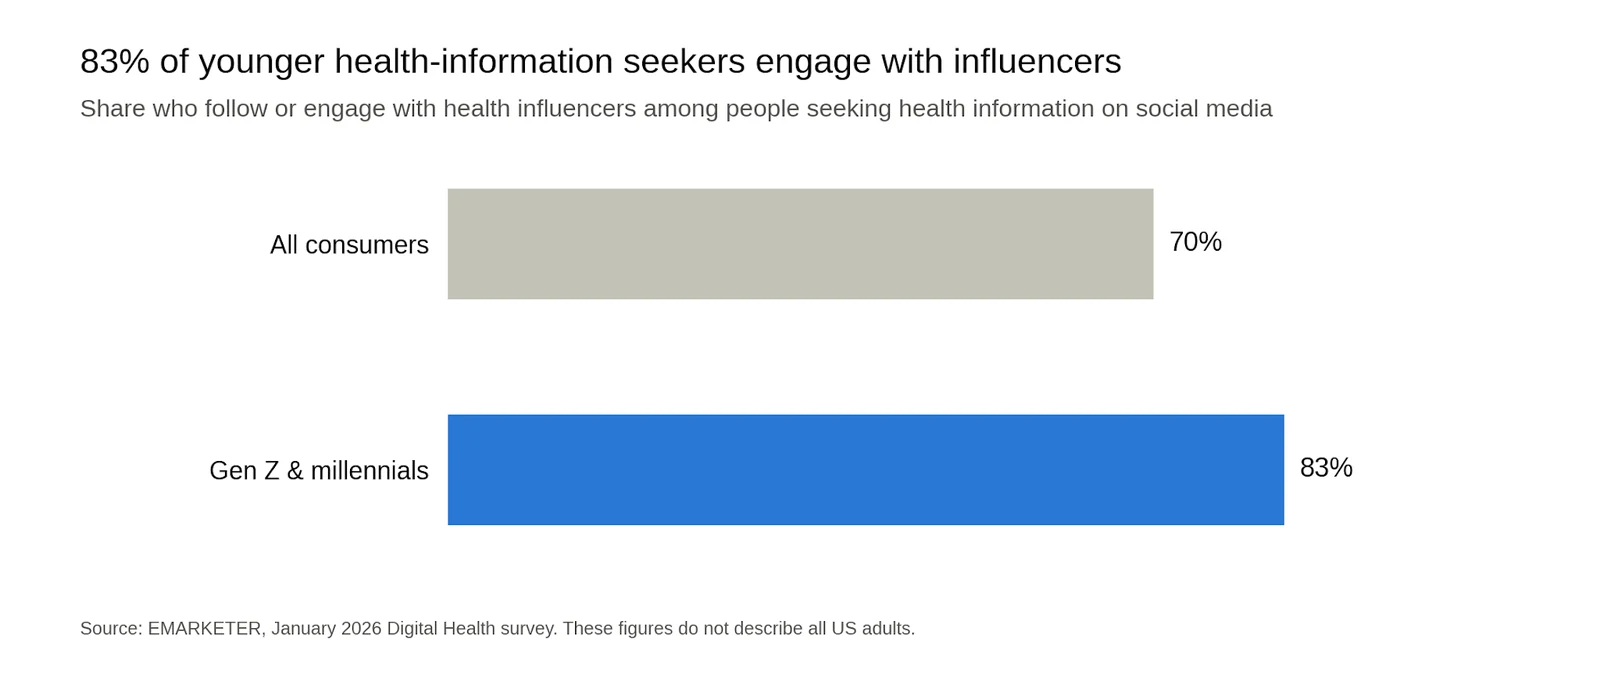
- Among consumers who look up health information on social media, 70% follow or engage with health influencers, rising to 83% among Gen Z and millennials, per eMarketer's January 2026 Digital Health survey.
- Almost half of US social media users who interact with health influencers, 48%, follow people who live with a condition they're interested in, per eMarketer's January 2026 US Digital Health survey.
What this means: The reach figures differ because the questions differ. Pew's 40% counts anyone who ever gets health information from influencers or podcasts, its 36% counts social media use "at least sometimes", and KFF's 60% and 31% split occasional from monthly use. All of them agree that the audience is large, young-leaning and mostly passive, which favors content built to stop a scroll. Our guide to social media marketing for health brands covers the formats that fit that behavior.
Medical Influencers and Credentialed Creators: Content and Evidence Statistics
Credentialed creators carry most of the medical conversation on social media, though a credential does not guarantee strong evidence behind a claim.
- Influencers with a conventional medical background mention professional medical treatments in 38% of posts and medical conditions in 30%, against 6% and 12% for influencers who list no credentials, per Pew's analysis of 535,512 posts.
- Dietitians and nutritionists mention nutrition in 52% of their posts, and self-described researchers cite an outside source in 30% of theirs, against 9% across all health influencers, per the same Pew analysis.
- In 309 clinician-made YouTube videos on cancer and diabetes, 62.5% of claims rested on very low or no evidence and only 19.7% on high-quality evidence, and videos in the weakest-evidence group were associated with approximately 35% higher view counts than those in the high-evidence group, per a 2026 JAMA Network Open study.
- About 80% of physicians use social media for professional purposes, per Sermo and LiveWorld survey results reported by eMarketer.
- Agencies now run dedicated rosters of medical creators: EvolveMKD works with more than 500 physician creators on deals such as injectables and contraception, as reported by Digiday.
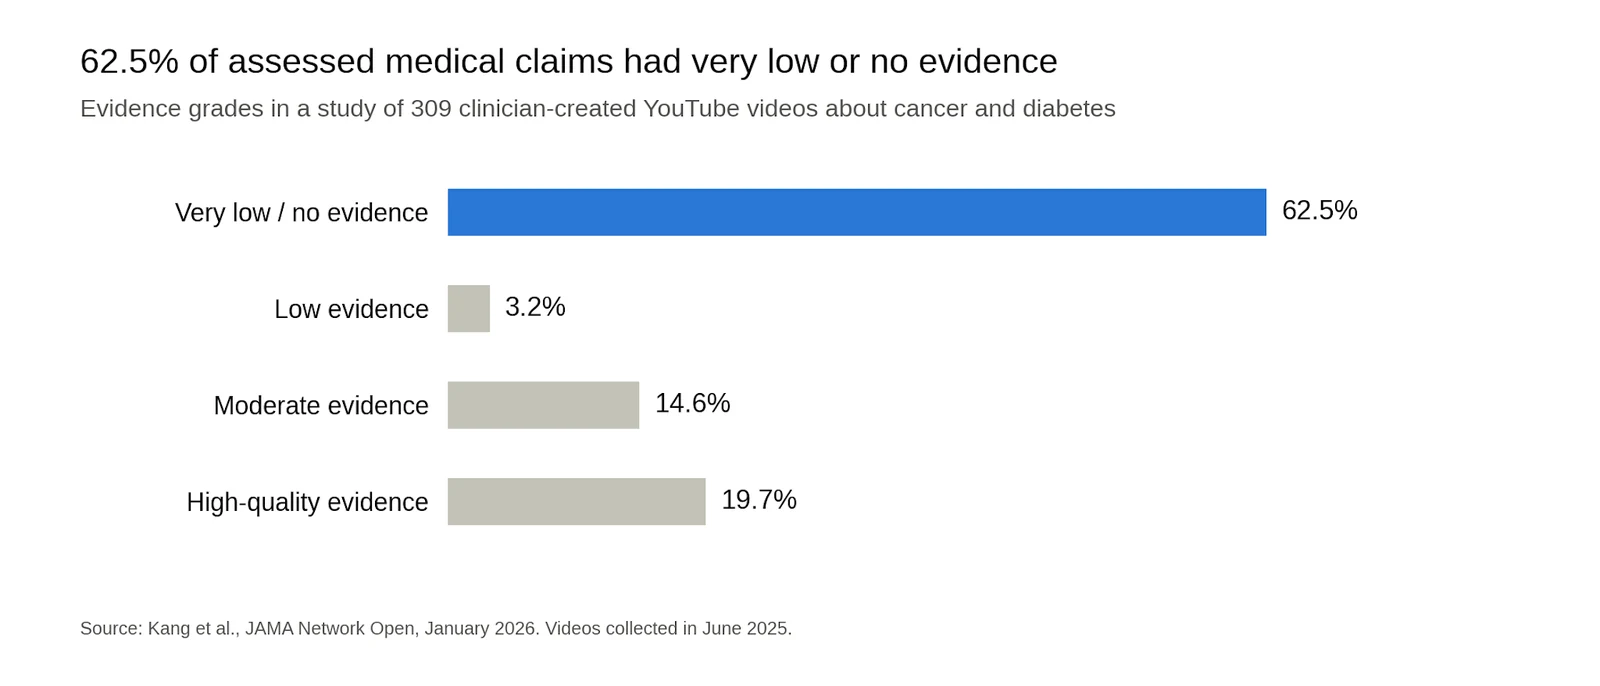
What this means: In the JAMA sample, weaker evidence was associated with higher view counts. The study does not establish that weak evidence causes higher engagement; it shows why popularity and professional credentials are not reliable substitutes for checking a medical claim. Treat a credential as a reason to brief more carefully, with the supporting studies attached to the brief. For prescription and physician programs, our pharma and physician influencer guide covers review owners and escalation.
Health Influencers on Instagram, TikTok and YouTube: Platform Statistics
Instagram is where health creators are, while YouTube is where health-information seekers increasingly go.
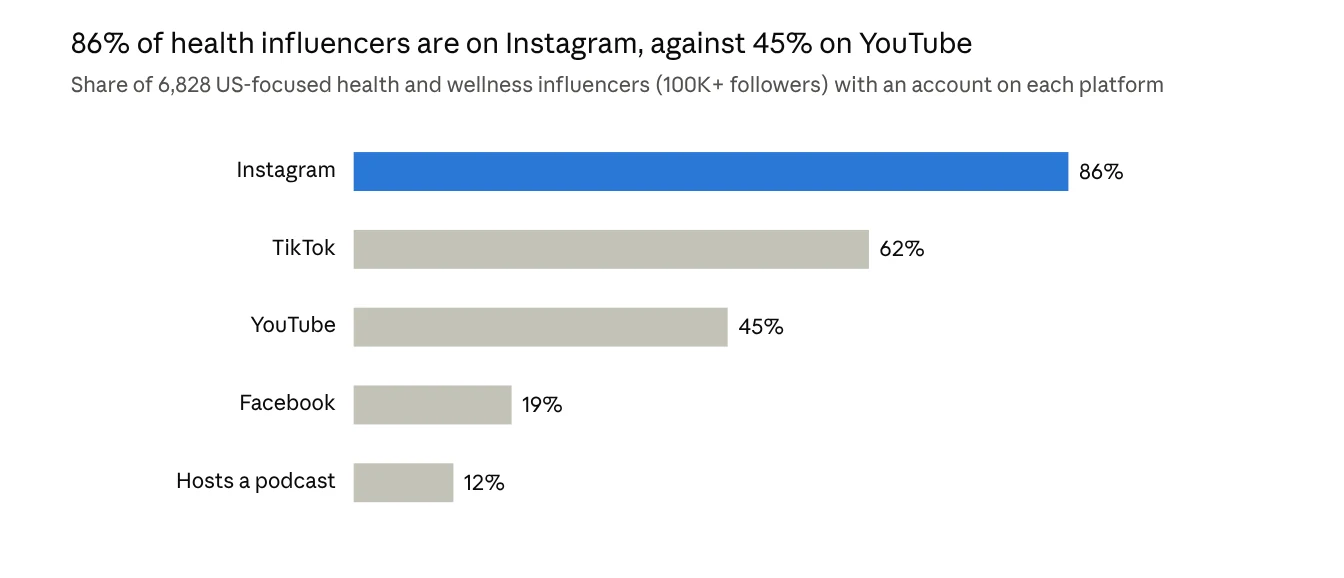
- Nearly all health and wellness influencers studied by Pew, 86% of them, have an Instagram account, against 62% on TikTok, 45% on YouTube and 19% on Facebook, among 6,828 influencers with more than 100,000 followers.
- The average health influencer keeps accounts on just two social sites, and 12% host a podcast, per the same Pew study.
- Among consumers who use social media for health information, 66% turn to YouTube, up from 52.9% a year earlier, making it the most-used platform for health queries, per eMarketer's January 2026 Digital Health survey.
- In the same eMarketer survey, 61% of people who seek health guidance on social media say they have followed advice from someone there, even when it contradicted their doctor.
- Healthcare, pharma and biotech organizations average 3.7% Instagram engagement, 3.3% on LinkedIn, 2.7% on Instagram Reels, 1.9% on Facebook and 1.0% on TikTok, per Hootsuite's April 2025 healthcare benchmarks.
What this means: Hootsuite's 1.0% TikTok figure sits well below the 2.5% Dash Social measured for health and wellness brands. The two studies cover different account sets (healthcare, pharma and biotech organizations against consumer health brands) and different periods, and Dash divides engagement by views. For health brands, the practical split is Instagram for creator supply, TikTok for discovery and commerce, and YouTube for longer explanations that viewers act on.
Influencer Marketing in Healthcare: Sponsorship, Disclosure and Enforcement Statistics
Supplement content is the most promotional corner of health social media, and supplement marketers have already been put on formal notice by regulators.
- Some 38% of posts from health and wellness influencers contain a sponsorship or another appeal to use a product, service or subscription, rising to nearly half of posts that discuss health topics directly, per Pew's analysis of 6,334 influencers from February to April 2026.
- Promotion appears in 66% of posts about non-prescription medications and supplements, 56% of posts about men's health or physical appearance and 52% of posts about nutrition or longevity, per the same Pew analysis.
- Just 9% of posts cite an outside source while making a health claim and 11% warn of a specific health harm, while 92% of influencers promote at least occasionally and 33% do so in most of their posts, in the same Pew analysis.
- In April 2023, the FTC sent notices of penalty offenses to approximately 670 companies marketing OTC drugs, homeopathic products, dietary supplements or functional foods, covering claim substantiation and endorsements.
- FDA enforcement letters on drug advertising fell from over 130 a year in the late 1990s to three in 2023; in September 2025, HHS said the FDA would write to several thousand drug sponsors and extend oversight to influencer partnerships and sponsored content.
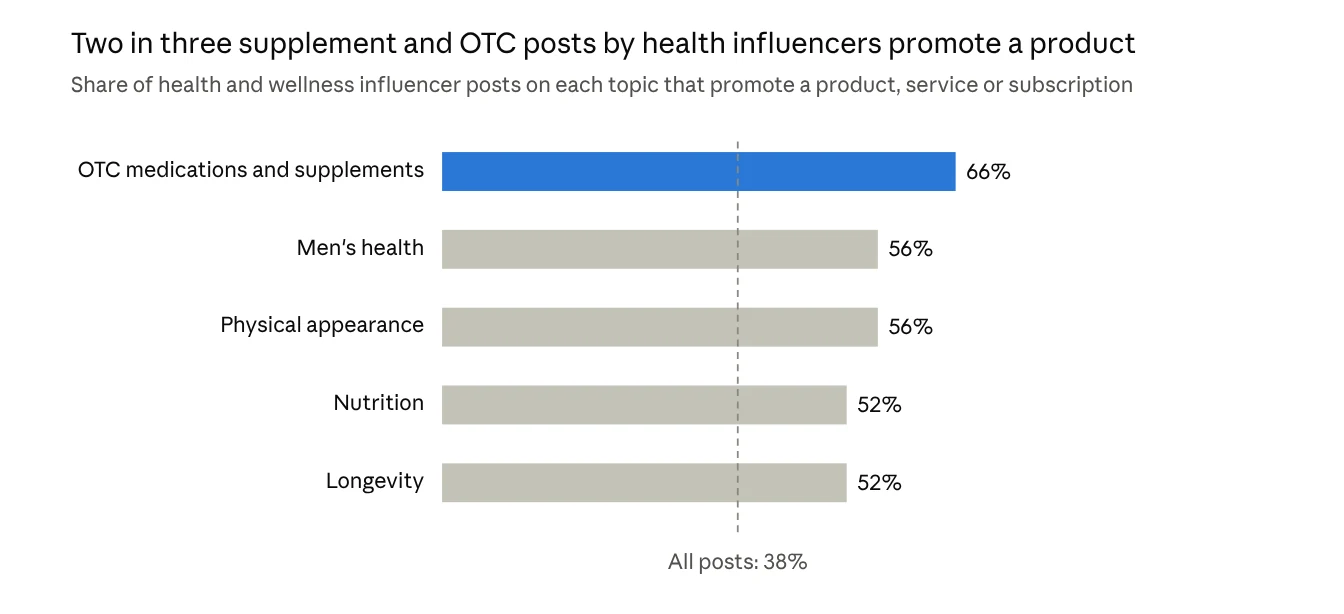
What this means: The 66% promotion rate on supplement posts and the 9% sourcing rate together describe the risk: the category sells hardest with the least evidence on screen. Build substantiation into the brief before a creator records.
Our guide to UGC compliance in healthcare marketing covers consent and review workflows, and the GLP-1 marketing strategy covers platform rules for weight-loss offers.
How to Use Healthcare Influencer Benchmarks in a Creator Program
- Set engagement targets from health-creator medians. Use the IQFluence health and wellness medians as the floor and the p75 line (about 1.3% on Instagram micro, 1.0% on TikTok micro) as "good", and switch to view-based metrics once posts run as ads.
- Budget by tier, then price credentials separately. Start from the $300 to $500 micro band and add a credential premium of 40% or more only for content that makes a claim a professional should stand behind.
- Match the creator to the claim. Pair registered dietitians or pharmacists with supplement and OTC claims, and use lifestyle creators for routines and volume, then compare revenue per post and total revenue across both.
- Plan for discovery and commerce. Two-thirds of this audience finds health content passively, so hooks matter more than search; for supplements, test TikTok Shop with affiliate creators alongside Instagram and YouTube.
- Write substantiation into every brief. Attach the evidence for each claim, set disclosure placement for organic posts and whitelisted ads, and keep a record of approvals.
inBeat runs creator programs for health brands, from supplement and telehealth launches to subscription and app growth. See how our healthcare influencer marketing agency builds creator rosters, briefs and paid amplification for health categories.
How We Sourced These Healthcare Creator Statistics
External statistics link to their publishers. The inBeat paid media figures come from our team's internal benchmark workbook. We used platform-scale datasets (IQFluence, Dash Social, Collabstr, NielsenIQ), nationally representative surveys (Pew Research Center, KFF), research firms (McKinsey, eMarketer), peer-reviewed research (JAMA Network Open), US regulators (FTC, HHS) and vendor rate guides (IQFluence, LaunchPoint), which we label as vendor data in the text.
Most data was published between April 2025 and October 2026; the 2023 FTC notices appear as a dated enforcement event. Most figures describe US audiences and creators.
FAQ
How should a supplement brand set an engagement target when health creators sit below the cross-industry median?
Benchmark against health creators only. IQFluence puts the Instagram micro-tier median for health and wellness at 0.40% and the top quartile at 1.27%, against a 0.97% median for all creators, so a health creator at 1% is outperforming most of its category. Once a post runs as an ad, judge it on view-based engagement and cost per result.
Do credentialed creators justify their premium for an OTC or supplement launch?
They justify it when the content makes a claim that needs a professional behind it. In one IQFluence test, registered dietitians converted at 1.4% against 0.9% for wellness creators, but the cheaper cohort produced more total revenue through volume. Most supplement programs use both, with credentialed creators carrying the claims and lifestyle creators carrying reach.
Which benchmark applies when a creator post is run as a whitelisted ad?
Evaluate whitelisted ads against your own paid campaign results, using consistent engagement definitions alongside cost per acquisition or other conversion metrics. Dash Social's health and wellness figures provide context for brand-account content, but its dataset excludes paid ads.
For example, inBeat's reported consumer health link CPC moved from $3.64 in 2025 to $1.95 in 2026 YTD. The latter slice contains one brand; use a relevant account baseline and the same conversion event when evaluating your own whitelisted ads.
How much of this data applies outside the US?
Most of it describes US audiences: the Pew, KFF, eMarketer and NielsenIQ figures are US-only. The IQFluence engagement benchmarks and Collabstr rates draw on global creator pools, and McKinsey's survey covers the US, UK, Germany and China, so they travel better; for other markets, check local platform mix and ad rules before reusing the targets.