

Two brands can see their share of search rise for completely different reasons. One gains branded searches; the other stays flat while competitors lose attention. The percentage moves in the same direction, but the underlying demand picture tells a different story.
Research covered by Marketing Week reported an average correlation of around 83% between share of search and market share across the studied cases. That makes the metric worth monitoring, while leaving marketers with a harder question: what actually caused the movement?
This guide explains how to calculate share of search, recognize misleading signals, and assess changes alongside CAC, MER and market-share data.
P.S. For brands running creator and paid social campaigns, inBeat's influencer marketing agency brings those programs together.
TL;DR: Share of Search Key Answers
- What it measures. Your brand's share of branded search interest within a defined competitor set. The percentage can increase even when your own search volume stays flat.
- What the evidence supports. Share of search often moves with market share, although the relationship varies by category and cannot establish campaign-level causation.
- How to measure it. Use cleaned brand keywords, a fixed competitor set and a consistent data source. Review longer-term trends with six- to twelve-month rolling averages.
- Where it falls short. Thin search volumes, generic brand names, negative publicity and low-consideration purchases can distort the signal.
- How to use it. Compare branded search volume and competitor movements alongside CAC and MER before making budget decisions.
What Is Share of Search and Who Defined the Metric
Take every search for your brand in a period and divide by the total searches for all brands in your category.
The EDO white paper on the metric states it exactly this way, as brand searches over the sum of searches for all category brands, and notes that the basic formula does nothing to handle ambiguous terms (EDO white paper).
A hypothetical three-brand running shoe category makes it concrete. If Brand A draws 50,000 branded searches in a month, Brand B 30,000 and Brand C 20,000, Brand A's share of search is 50%, Brand B's is 30% and Brand C's is 20%.
Les Binet, James Hankins and the IPA Origin of the Metric
Les Binet brought the idea to the IPA's EffWorks Global 2020 program, where he presented share of search as a predictive measure of brand performance (IPA EffWorks).
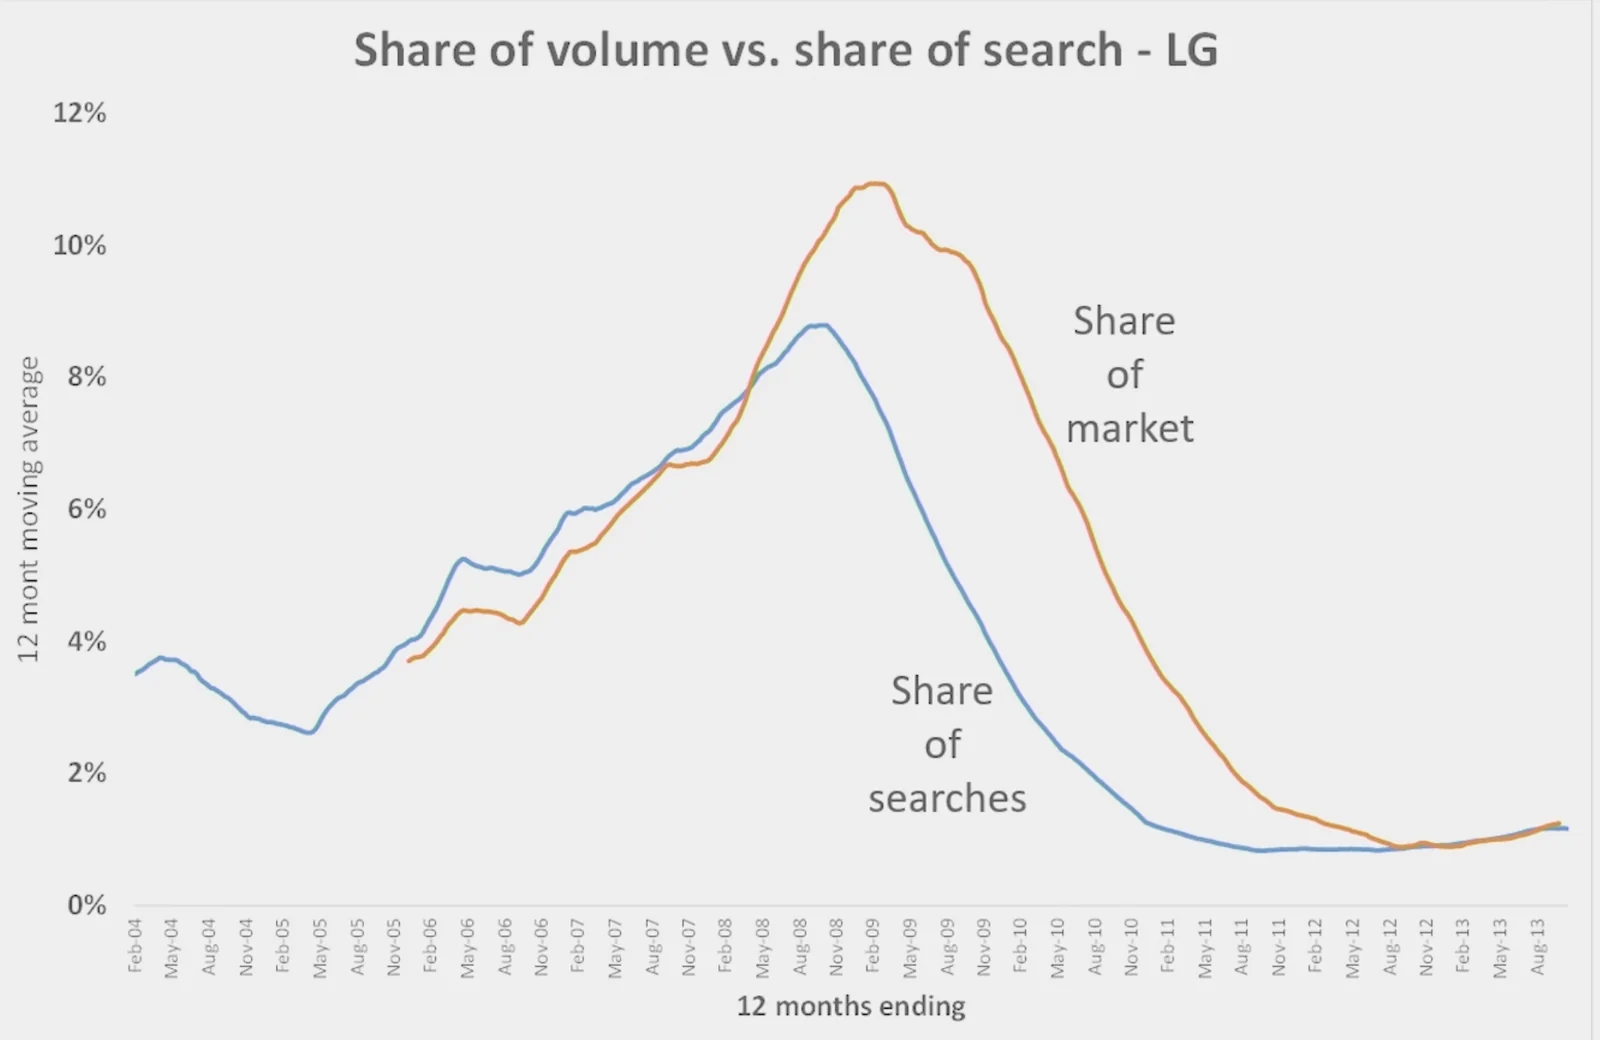
His framing, as Objective Platform recounts it, was that Google acts as the world's biggest database of human intentions, so brand search volume carries a great deal of information about brand strength (Objective Platform).
James Hankins then ran the cross-industry think tank work that put numbers on the relationship, and the Share of Search Council now hosts the ongoing material (Share of Search Council).
Why Search Behavior Counts as an Unprompted Demand Signal
A branded search records an action rather than a response to a survey question. That makes it useful for observing interest, although the motivation remains unclear. Someone might be comparing products, looking for customer support or responding to a news story.
Share of search also differs from SEO visibility. The former tracks relative interest in brand names within a defined competitor set, while the latter reflects how prominently websites appear in search results. Both provide useful information, but they answer different questions.
Does Share of Search Predict Market Share? What the 83% Correlation Shows
Researchers have examined how closely branded search interest follows market share across different industries. Their findings offer a useful starting point, although the relationship varies by category and requires further validation.
The 83% Finding Across 30 Case Studies
The IPA's cross-industry think tank examined 30 case studies across 12 categories and seven countries. The findings showed a close relationship between share of search and market share, with EDO reporting an average correlation of 83% across the studies (IPA, EDO).
That figure describes how closely the two measures move together, rather than the percentage of market share explained. The relationship also varies by category and country, so brands need to compare their own search trends with actual market share before relying on the metric for predictions.
Kantar's Validation on Salience and Sales
Kantar reports that industry studies, including Binet's, and its own validation work for clients show share of search correlates with both salience and sales (Kantar).
Why a Category-Level Fit Is Not Campaign-Level Causation
Distribution changes, pricing, seasonality, news and advertising can influence branded search and sales simultaneously. A competitor's stockout, for example, might increase both your search share and market share even when your campaign activity stays unchanged.
Evaluating the impact of a specific campaign requires separate evidence. Holdout tests, geo experiments or marketing mix modeling can help estimate incremental effects, with share of search serving as a supporting indicator rather than proof of campaign-driven revenue.
| Claim | What the evidence supports | What it cannot prove | What you need to verify it for your brand |
|---|---|---|---|
| Share of search tracks market share | Average correlation of around 83% reported across 30 cases in 12 categories | That your category fits the average, or that the remaining variance is small for you | Several years of consistently measured share of search and reported market share data |
| Share of search correlates with salience and sales | Kantar and Binet industry and client validations | That any one campaign caused a sales change | Keyword categorization audit plus an incrementality test for the campaign in question |
| Share of search leads market share | Practitioner readings that search moves before purchase in considered categories | A fixed lead time that applies across categories | Cross-correlation of your series at different lags |
| Share of search can replace share data | A usable proxy where share data is slow or missing | That it substitutes for sales data where you have it | Compare both where available before relying on one |
The share of search and market share findings come from the IPA think tank and EDO research, while the evidence on salience and sales comes from Kantar's validation work linked above.
Lead Time and the Leading-Indicator Claim
Search behavior can precede purchases in considered categories, but the gap varies. Someone buying a car may spend months researching, while an app subscription can happen the same day. The relevant lead time therefore depends on the category and its typical purchase cycle.
Compare several years of share of search and reported market share data, aligning both series to the same reporting periods.
If market share is available quarterly, test whether search trends lead changes by one or more quarters. Use longer historical periods and check whether the relationship holds over time before treating the metric as predictive.
If the best fit is at zero lag, the metric is still useful as a cheap, fast mirror of share. It just isn't an early warning, and presenting it as one would be the first way the number loses credibility with finance.
Share of Search Versus Share of Voice
Share of search and share of voice measure different aspects of brand performance. Share of voice tracks competitive visibility across advertising and media conversations, while share of search captures relative branded search interest.
Choosing between them depends on the channels you use and the questions you need to answer.
Where Traditional Share of Voice Measurement Falls Short
Traditional share of voice relied on competitive advertising spend and impressions across channels such as TV, radio and print. Digital measurement has expanded the concept to include social media mentions, online conversations and organic visibility.
The challenge for creator-led brands is coverage. Private ads, whitelisted creator content and platform-specific activity can escape competitive tracking tools, leaving gaps in spend-based SOV estimates.
Social listening captures some of the resulting conversations, although it provides a different measure from paid media exposure. The reliability of SOV therefore depends on which channels and data sources the analysis includes.
What Branded Search Adds to Competitive Visibility
Paid media share of voice measures a brand's share of advertising exposure, while social share of voice tracks its portion of industry conversations. Share of search adds another perspective by measuring how branded search interest compares with competitors.
For a creator-led TikTok advertising program, these metrics offer complementary signals. Social SOV shows how much tracked conversation a brand receives, while share of search reveals changes in relative search interest. Both need to be considered alongside CAC, MER and sales data to understand commercial impact.
The data requirements also differ. Branded search trends are accessible through tools such as Google Trends, while comprehensive competitive advertising and social listening data often require paid platforms.
| Metric | What it measures | Data required | Digital and creator coverage | Best use |
|---|---|---|---|---|
| Share of voice | Share of advertising exposure, media visibility or industry conversations | Competitive spend, impressions or brand mentions | Varies by data source; private ads and some creator activity may be missed | Comparing competitive media presence and brand conversations |
| Share of search | Share of branded searches within a defined competitor set | Comparable branded search data and cleaned keyword lists | Captures search interest from any channel, but misses interest that never leads to a search | Tracking relative branded search interest over time |
| Market share | Share of category sales | Retailer, panel or internal sales data | Channel-agnostic | Confirming actual sales performance |
When to Track Both
Track both when reliable competitive visibility data is available. Share of voice helps explain how much advertising exposure or industry conversation your brand receives, while share of search shows how branded search interest compares with competitors.
Report them alongside sales and efficiency metrics to distinguish changes in visibility, search behavior and commercial results. Keep the measurement sources consistent so the comparison remains useful over time.
How Do You Calculate the Share of Search?
Build a spreadsheet with your fixed competitor set in rows, months in columns and a documented keyword list per brand. Calculate monthly share of search, then use a six- to twelve-month rolling average to evaluate longer-term trends. The five steps below show how to build a consistent measurement process.
1. Define the Category and Fix the Competitor Set
List every brand a buyer in your category would realistically consider, including private labels and challengers that don't yet show up in trade data.
Then freeze the list for the measurement period, usually a year, and log any addition with the date and reason so a share change can never be explained away by a changed denominator.
The category boundary is the biggest judgment call you'll make.
A sparkling water brand measured against other sparkling waters tells a different story than the same brand measured against all soft drinks, and both can be right for different decisions, so write down which question the set is meant to answer.
2. Build and Clean the Branded Keyword List
For each brand, collect the core name, common misspellings, product-line queries that include the brand and any sub-brands buyers use. Then remove queries where the brand term carries a different meaning, since Kantar ties the metric's validity directly to accurate keyword categorization.
A hypothetical five-brand DTC skincare set shows why this matters.
If one brand is called Glow, raw volume for that word includes recipe searches, song titles and lighting products, so you'd keep only queries like Glow serum, Glow skincare and Glow moisturizer, and you'd apply the same rule to any competitor with a generic name.
Work through the list in this order:
- Pull the top branded queries per brand and tag each as brand, product-line or ambiguous.
- Drop ambiguous queries unless a modifier pins them to the category.
- Decide whether competitor comparison queries, such as Brand A vs Brand B, count for both brands, neither, or are excluded, and apply that rule everywhere.
- Save the final list as a tab in the workbook with a version date.
3. Pull Monthly Search Volume From a Consistent Source
Choose one source and stay with it. Keyword planning tools give absolute monthly volumes but round and bucket them; trend indices give relative scores that are comparable across terms but not absolute counts, and mixing the two breaks comparability between months and between brands.
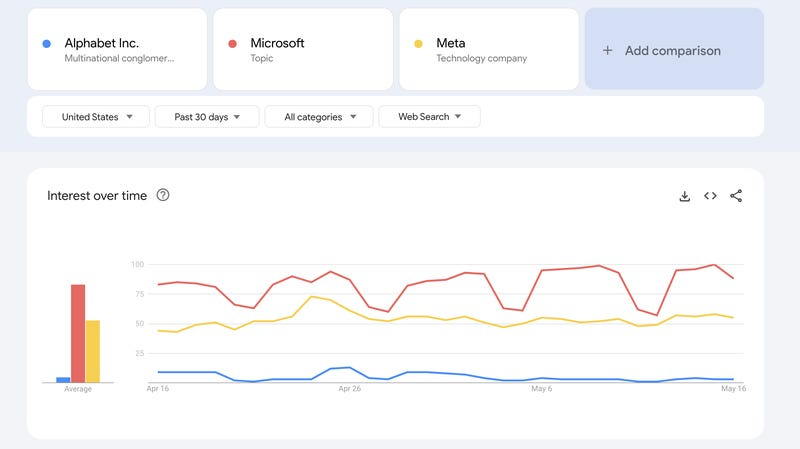
Pull the same geography every time, since a brand's share in the US and its share in Canada are different metrics. If your tool caps the number of terms per request, pull a stable anchor brand in every batch so the indices can be chained.
4. Convert the Numbers to Shares and Log Every Decision
For each month, sum the cleaned volume across all brands in the set, then divide each brand's volume by that total.
Keep a change log beside the data. Every excluded query, every added competitor and every source change gets a dated line, because the first question a skeptical CFO asks is what changed in the method, and the honest answer should take ten seconds to find.
5. Read the Quarterly Trend and Ignore Single Months
Use a six- or twelve-month rolling average to evaluate longer-term trends, as recommended by the IPA. A three-month average can help spot emerging changes, although it remains more sensitive to seasonal fluctuations and temporary spikes. Keep the raw monthly data available so you can investigate unusual movements.
Single months swing on news, seasonality and tool noise, and a share that moves from 18% to 21% and back inside a quarter has told you almost nothing.
Set a review threshold based on your category's historical volatility. For example, a sustained change beyond the usual range of a twelve-month rolling average could trigger a closer look at competitor activity, search volume and campaign timing.
Document the threshold before evaluating results so short-term fluctuations lead to investigation rather than premature decisions.
Share of Search Limits in Low-Volume, Impulse and Crisis Categories
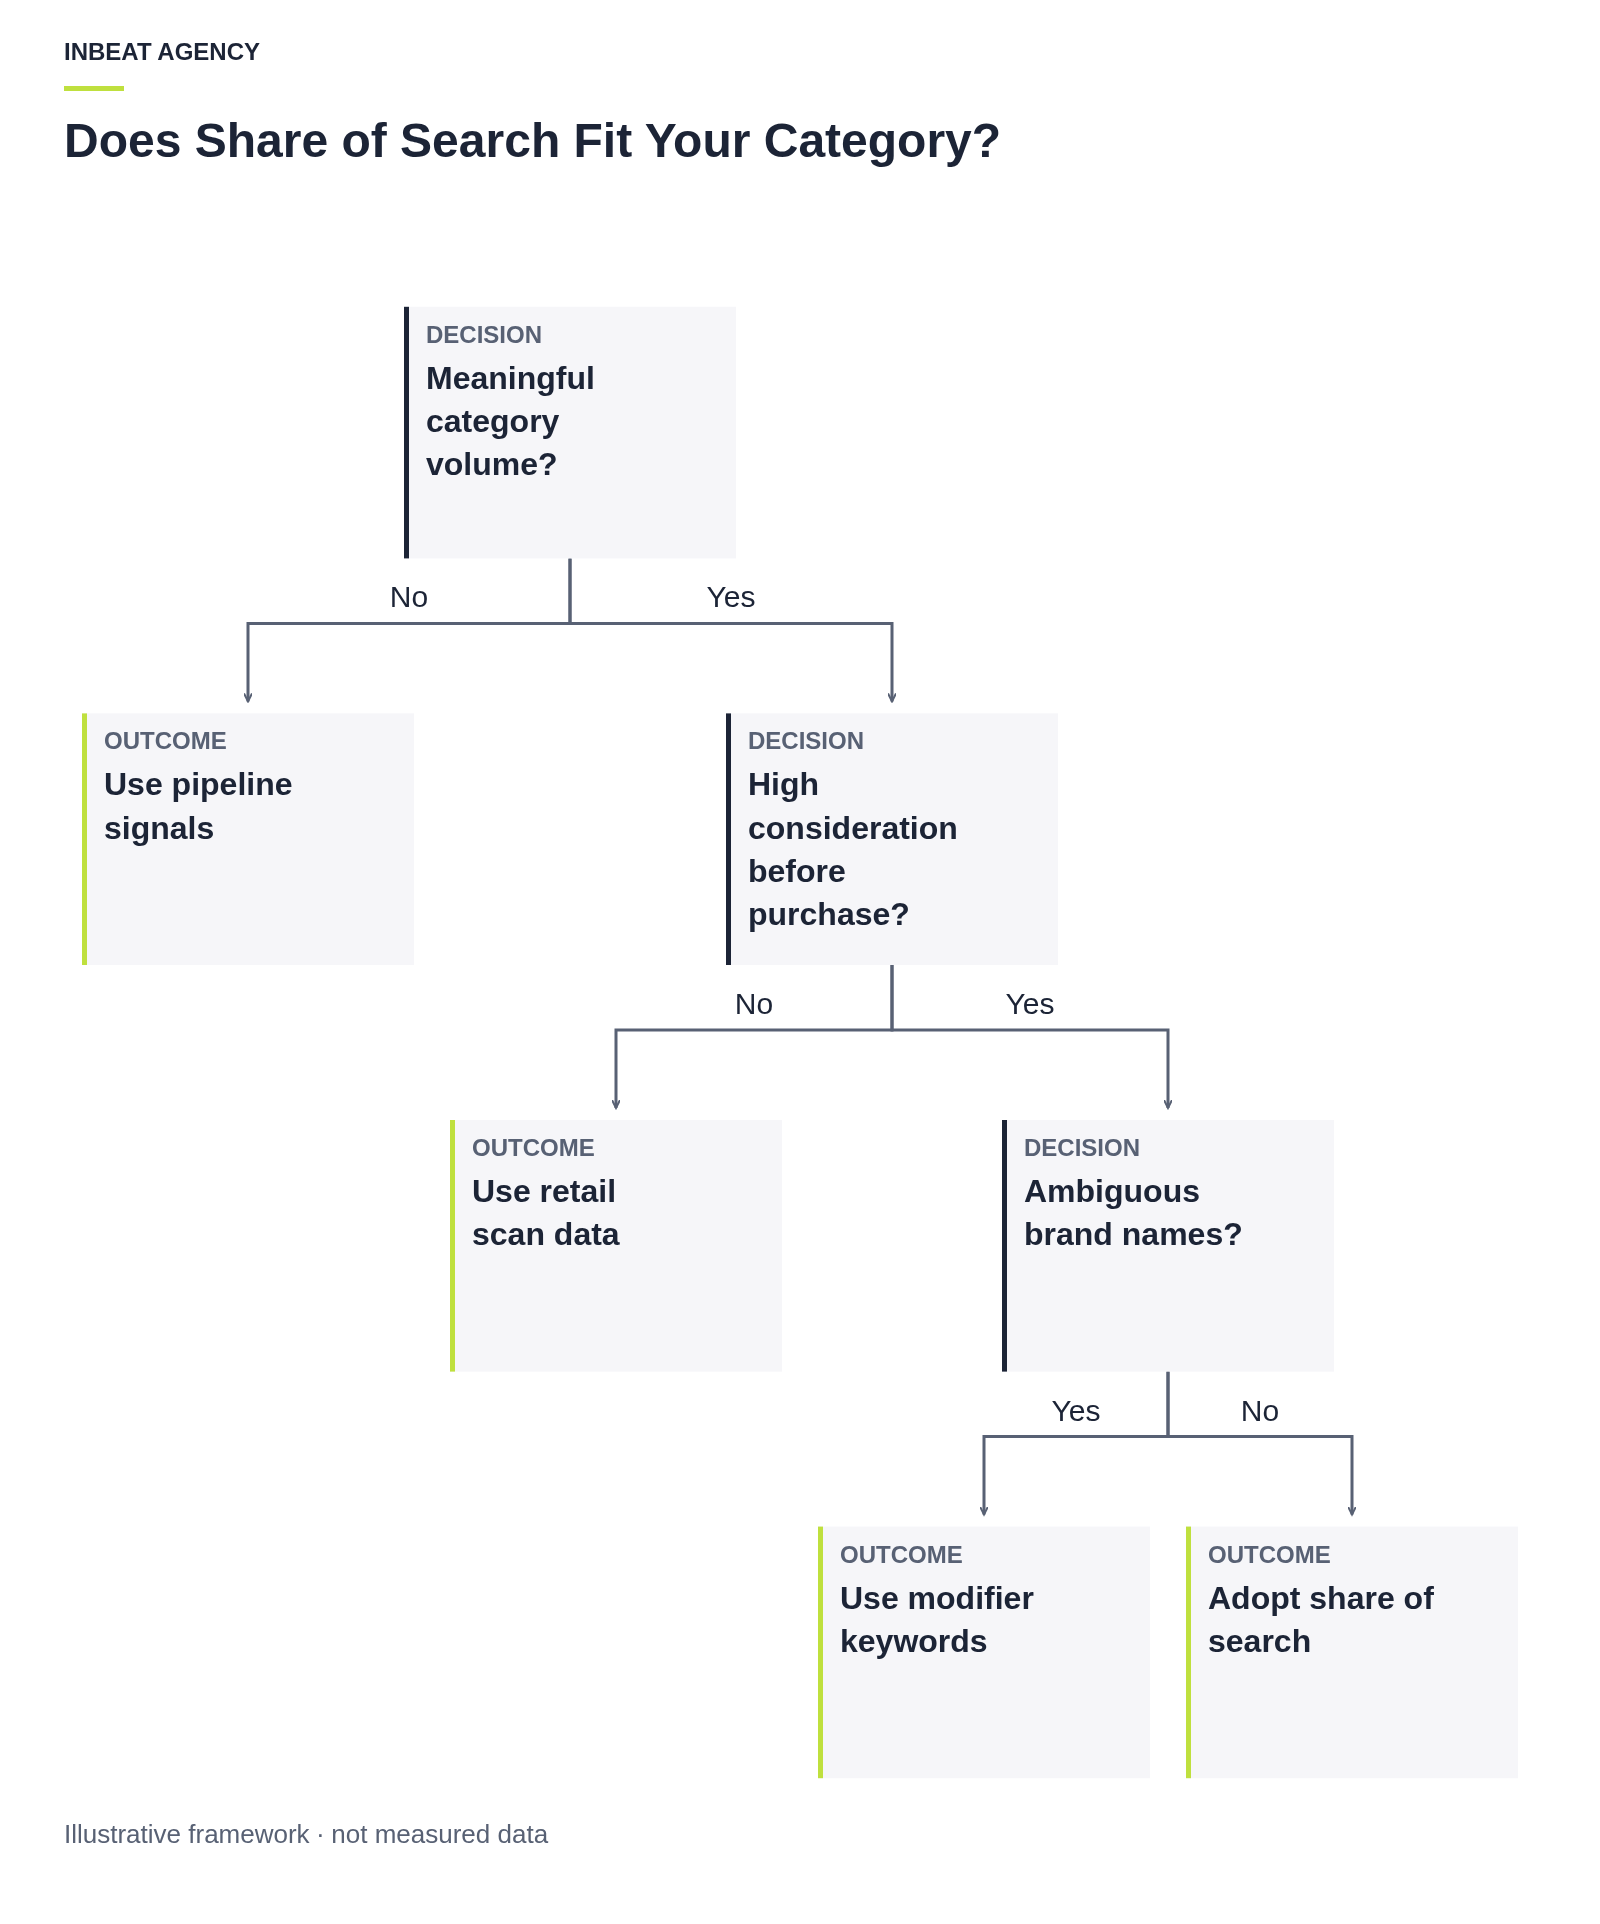
Share of search works best when branded searches are frequent enough to track, clearly associated with the right brands and relevant to how people discover products.
Four conditions can make the metric less reliable. Check them before deciding how much weight to give it in your reporting.
Thin B2B Search Volume
In narrow B2B categories, a product launch or industry event can cause a noticeable jump in branded searches even when broader demand changes little. Low search volumes and rounded estimates also make monthly comparisons less reliable.
Check search volumes for individual brands and the category total, then look for consistency over several months. If the data remains unstable, use a longer rolling average or supplement it with qualified inquiries and pipeline data, as covered in this guide to choosing a B2B demand generation agency.
Impulse and Low-Consideration Purchases
In categories where purchases happen quickly or in stores, many buyers choose products without searching for them first. Share of search can therefore reflect only part of the purchasing audience, particularly when shelf placement, pricing and availability influence decisions.
For grocery and other low-consideration products, compare branded search trends with retail sales, distribution data and buyer research where available. Search interest can provide additional context, but commercial data remains essential for understanding actual purchasing behavior.
Negative PR and Sentiment Spikes
Branded searches can increase after a product recall, controversial news story or viral complaint. That increase may raise share of search even when purchase interest remains unchanged or declines.
When an unusual spike appears, review the leading branded queries and relevant news coverage to understand what prompted the attention. Annotate affected periods and preserve the original data.
If you create an adjusted view excluding crisis-related activity, show it separately so the comparison remains transparent.
Ambiguous Brand Names and Generic Terms
Brands with common-word names can attract searches unrelated to their products. Counting every query may overstate brand interest, while using only product-specific modifiers can exclude genuine branded searches.
Review the actual queries and apply comparable filtering rules across competitors. Where ambiguity remains, disclose the limitations and focus on changes over time rather than treating differences in search share as precise measures of relative demand.
Use these checks to decide whether share of search deserves regular tracking, should serve only as a directional indicator, or needs to give way to retail, survey or pipeline data.
Share of Search With CAC, MER and Creator Tests
Share of search adds context to CAC and MER by showing how branded search interest shifts relative to competitors. It helps identify changes worth investigating, while CAC and MER show what's happening to acquisition and revenue efficiency.
Share of Search as the Upper-Funnel Demand Indicator
CAC and MER measure acquisition and revenue efficiency, while share of search shows how branded search interest is distributed across competitors.
A rising share can reflect more searches for your brand, fewer searches for competitors, or both. That's why it's worth tracking your own branded search volume alongside the category total before drawing conclusions about demand.
Add share of search to the monthly performance dashboard, showing a three-month average for early signals and a twelve-month average for the broader trend. Review meaningful changes alongside branded search volume, CAC and MER before deciding which actions to take.
Trend Pairings With CAC and MER
A rising share with flat CAC may indicate growing brand interest, although it can also reflect declining search activity for competitors. Likewise, a falling share alongside improving MER could mean the brand is converting existing demand more efficiently while competitors attract more attention.
The pairings below help identify what to investigate before making budget decisions.
| Share of search trend | CAC or MER trend | Likely reading | Next test |
|---|---|---|---|
| Rising | CAC flat or MER flat | Relative search interest is increasing, but the source of the gain is unclear | Check branded search volume and competitor trends before testing new creative |
| Rising | CAC improving or MER improving | Search share and efficiency are moving favorably, though the connection remains unproven | Validate search volume and incremental conversions before scaling |
| Falling | CAC improving or MER improving | Efficiency is improving while the brand loses relative search interest | Check competitor activity, search volume and spend mix before reallocating budget |
| Falling | CAC worsening or MER worsening | Both indicators are declining, potentially for different reasons | Audit creative fatigue, pricing and competitor activity; test new concepts |
These pairings are starting hypotheses rather than established cause-and-effect relationships. Comparing branded search volume, category search trends, CAC and MER helps narrow down possible explanations.
Controlled experiments are still needed to determine whether specific campaigns generated incremental demand.
Creator and UGC Test Readouts in Branded Query Lift
Creator campaigns can influence branded search behavior, making search volume and share of search useful secondary metrics alongside CAC and MER. Track both measures for two to three months after launching a new creative batch, and compare their movement with campaign spend, reach and competitor activity.
Consider a creator whitelisting campaign that scales while CAC remains stable. An increase in branded search volume could indicate rising interest, while higher search share with unchanged volume might simply reflect declining competitor searches.
Either pattern gives the team something to investigate, with holdout or geo experiments helping establish whether the campaign contributed to the change.
Creative testing matters here. Different personas, messages and formats can produce different responses, so it pays to brief creators for native content and to source variations through a UGC agency where in-house capacity is thin.
Review the results quarterly, documenting which concepts ran, how much was spent and whether branded search trends changed during the testing period.
Planning creator tests and measurement together? Book a strategy call.
Frequently Asked Questions About Share of Search
How many months of share of search data do you need before the trend means anything?
Twelve months of data provides an initial baseline for examining seasonality and calculating a twelve-month rolling average. Two years or more gives you a clearer view of how that average changes over time.
Testing whether share of search leads market share requires a longer history of comparable data. Several years of observations are preferable, especially when market share is reported quarterly and you want to evaluate different lead times.
Should retailers and marketplaces be included in a brand's share of search competitor set?
Include them only when buyers treat them as a brand choice in your category, which is true for a retailer's private label competing on shelf and false for a marketplace that sells everyone's products.
If you include a retailer, measure only the queries tied to its own-brand products in your category, and document the decision so the denominator can be defended.
Can share of search replace a paid brand tracker?
Share of search can complement a paid brand tracker by showing changes in relative branded search interest at a lower cost. It provides a useful directional signal, while surveys measure awareness and consideration more directly.
Brand trackers also reveal how buyers perceive your brand, what influences their decisions and how those perceptions change. Use share of search for regular monitoring and retain survey-based research when you need to understand the reasons behind those changes.
How do you measure share of search for a brand whose name is also a generic word?
Start by reviewing the queries associated with the brand name. Remove unrelated searches and use product- or category-specific modifiers where needed, applying comparable filtering rules across competitors.
Modifier-based tracking can also exclude legitimate branded searches, so document these limitations. Focus on consistent trends over time and verify keyword coverage before comparing search shares across brands.
What can rising share of search alongside falling market share indicate?
The brand may be losing sales despite growing search interest, or its search share may be increasing simply because competitors are receiving fewer searches. Negative publicity, pricing problems and limited availability can also explain the divergence.
First check branded search volume and competitor trends, then review query intent, distribution and pricing. A delay between search interest and purchasing is another possibility worth testing.