%20(1).png)

Instagram crossed 3 billion monthly users in 2025, and it now earns more of Meta's US ad revenue than Facebook does. It has also become harder to win on: organic engagement fell again in 2026, and Reels now take close to half of the time people spend in the app.
The statistics below come from Meta, Pew Research Center, DataReportal, Socialinsider, eMarketer, and named industry reports, grouped by the questions marketers ask most (for cross-platform numbers, see our social media statistics): how big Instagram is, who uses it, what "good" performance looks like, and what it costs to advertise and work with creators there.
P.S. If you want these benchmarks applied to your own brand, our Instagram influencer marketing team runs creator programs and paid social for brands like Nordstrom and Soylent.
Key Instagram Statistics for 2026
| Metric | Figure | Source |
|---|---|---|
| Monthly active users | Over 3 billion | Meta |
| Ad reach | 1.99 billion | DataReportal |
| US adults who use Instagram | 50% | Pew Research Center |
| Average time in app | 1 hour 13 minutes a day | DataReportal |
| Average engagement rate | 0.45% (Q2 2026) | Socialinsider |
| Share of Meta's US ad revenue | 53.1% (2026 forecast) | eMarketer |
| Share of time spent on Reels (US) | 46% | Sensor Tower |
| Influencer collaborations on Instagram | 40% | Collabstr |
Instagram at a Glance
| Fact | Detail |
|---|---|
| Launched | October 6, 2010, by Kevin Systrom and Mike Krieger |
| Owner | Meta Platforms, which bought Instagram for $1 billion in 2012 |
| Head of Instagram | Adam Mosseri |
| Headquarters | Menlo Park, California |
How Many People Use Instagram? Monthly and Daily Active Users
Instagram has 3 billion monthly active users, making it one of only a handful of apps ever to reach that scale.
- Instagram reached 3 billion monthly users in September 2025, joining Facebook and WhatsApp above that mark, according to Mark Zuckerberg's announcement reported by CNBC.
- The last official milestone before that was 2 billion monthly users in October 2022, so Instagram added roughly a billion users in under three years, per the same CNBC report.
- Meta does not publish a daily active user count for Instagram alone. Its combined figure for Facebook, Instagram, WhatsApp, and Messenger reached 3.48 billion daily active people in mid-2025, per the same report.
- Instagram's advertising tools reached 1.99 billion users as of April 2026, according to DataReportal data summarized by Neal Schaffer. Ad reach counts targetable accounts, which is why it sits well below the 3 billion user figure.
- Instagram's ad audience grew by 90.8 million users (+5.5%) in the year to January 2025, faster than both Facebook (+4.3%) and TikTok (+2.0%), according to DataReportal's analysis of Meta's ad tools.
- Adam Mosseri has said that "almost all" of Instagram's recent growth came from DMs, Reels, and recommendations, per the Neal Schaffer roundup.
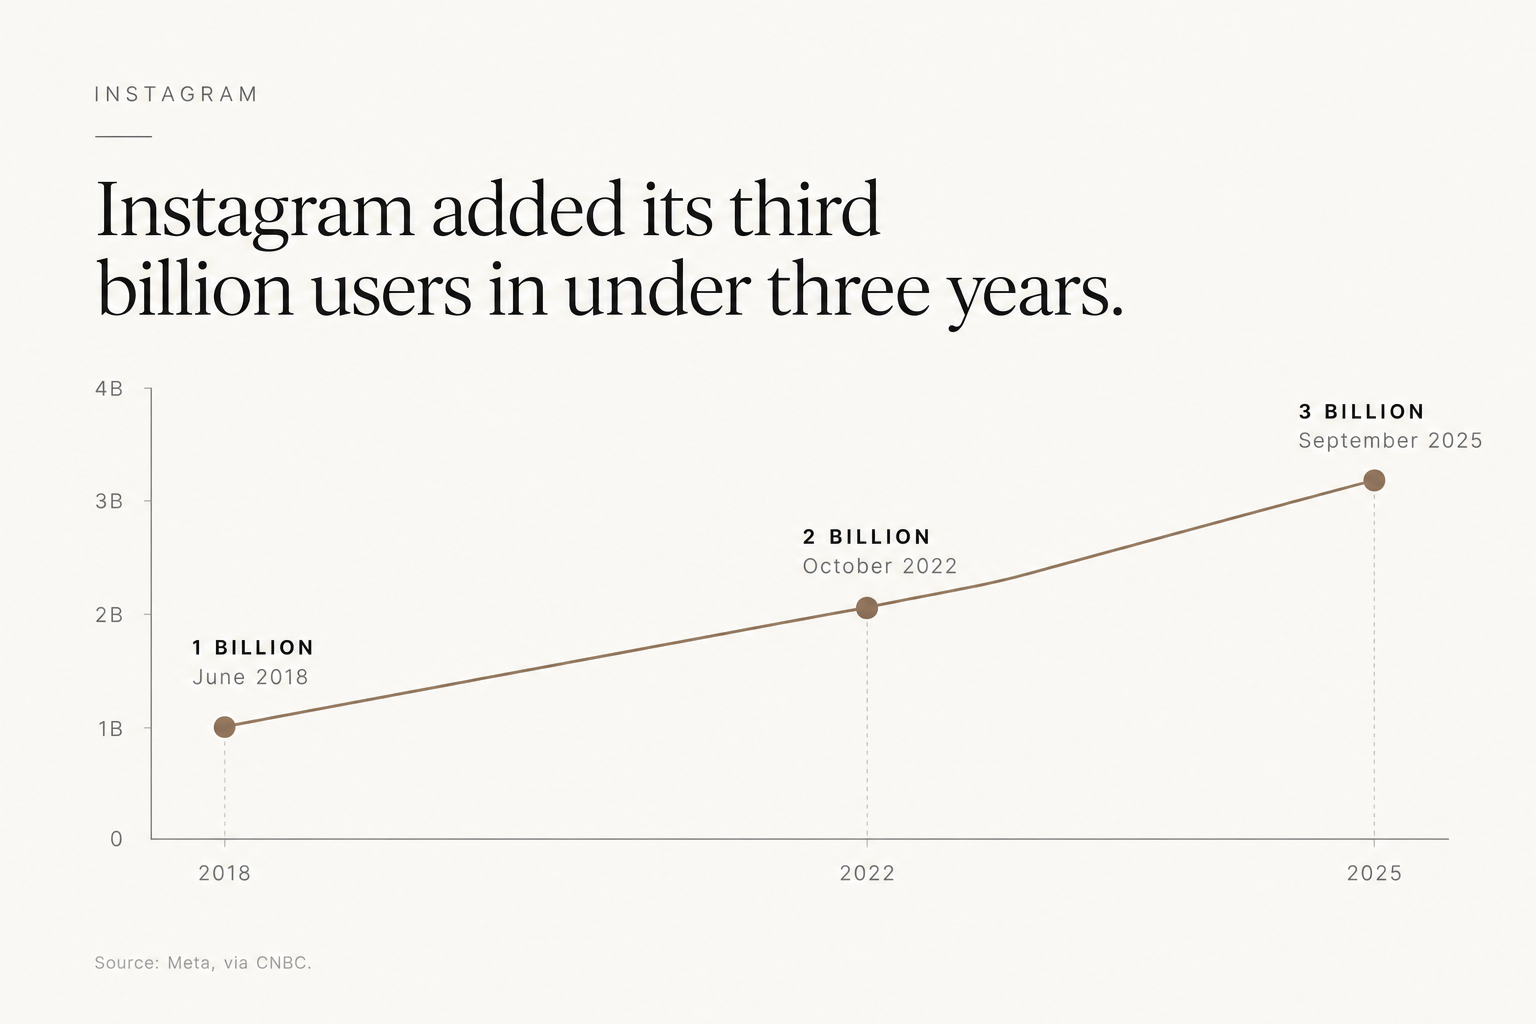
What this means: three different numbers describe Instagram's size, and they measure different things. The 3 billion figure is Meta's monthly active user count, the 1.99 billion figure is the audience advertisers can target, and the 3.48 billion daily figure covers all of Meta's apps together. Figures of "500 million" or "1.6 billion" daily Instagram users that circulate online are estimates, since Meta stopped reporting per-app daily users in 2024.
Instagram Demographics: Age, Gender, Income, and Country
Instagram's largest age group is 25 to 34, its global audience skews slightly male, and its US audience skews female and affluent.
Instagram Age Demographics
- Users aged 25 to 34 make up about 33% of Instagram's global ad audience (18.4% men, 14.6% women), the single largest age group, according to DataReportal's January 2025 analysis.
- The 18 to 24 bracket follows at 31.6% of the adult ad audience (17.2% men, 14.4% women), per the same DataReportal data.
- Only 8.5% of the adult ad audience is 55 or older, per the same analysis, so Instagram reaches older buyers far less efficiently than Facebook.
- 63% of US teens aged 13 to 17 use Instagram, behind YouTube and TikTok (68%), and use rises to 75% among 15- to 17-year-olds, according to Pew Research Center's 2025 teen survey.
- Instagram is the favorite social platform for 89% of Gen Z respondents in the 2025 Sprout Social Index.
Instagram Gender Demographics
- Instagram's global ad audience is 52.7% male and 47.3% female, per the same DataReportal data.
- In the US, the split reverses: 55% of women use Instagram compared with 44% of men, according to Pew Research Center's 2025 survey of 5,022 adults.
Instagram Users in the US
- Half of US adults say they use Instagram, up from 9% in 2012 and 35% in 2018, per the same Pew survey.
- Usage reaches 80% of US adults aged 18 to 29, then drops to 62% for ages 30 to 49, 40% for ages 50 to 64, and 19% for 65 and older, per the same Pew survey.
- Instagram skews affluent: 60% of adults in $100,000+ households use it, compared with 41% of those earning under $30,000, per the same Pew data.
- College graduates use Instagram at 58%, versus 41% of adults with a high school education or less, per the same survey.
- Rural adults lag behind: 37% of rural adults use Instagram, compared with 55% of urban and 54% of suburban adults, per the same Pew data.
Instagram Users by Country
India is Instagram's largest market by a wide margin. DataReportal's January 2025 ad-audience figures for the top ten markets:
| Country | Instagram ad audience |
|---|---|
| India | 414 million |
| United States | 172 million |
| Brazil | 141 million |
| Indonesia | 103 million |
| Turkey | 58.5 million |
| Japan | 57.5 million |
| Mexico | 48.8 million |
| United Kingdom | 33.4 million |
| Germany | 31.3 million |
| Argentina | 28.9 million |
- Later estimates put India at 480.55 million users and the US at 181.75 million, according to Statista's October 2025 figures cited by Neal Schaffer.
- Southern Asia alone accounts for 25.7% of Instagram's global ad audience, while Northern America accounts for 11.0%, per the same DataReportal data.
What this means: the global and US audiences look like two different platforms. Worldwide, Instagram leans young and male because of its size in India. In the US, it leans female, college-educated, and higher-income. Brands selling premium products to US adults under 50 are the ones for whom Instagram's demographics line up most closely.
Instagram Engagement Rate Benchmarks by Format and Account Size
The average Instagram engagement rate was 0.45% in Q2 2026, and it has fallen for two quarters in a row.
- Instagram's average engagement rate fell to 0.45% in Q2 2026, with every format lower than the previous quarter, according to Socialinsider's quarterly benchmarks.
- Across full-year 2025, the average engagement rate was 0.48%, down 24% year over year, based on 35 million posts from 447,613 brand pages, per the same Socialinsider study.
- Carousels lead all formats at 0.50% in Q2 2026, followed by Reels at 0.48% and single images at 0.33%, per the same quarterly data.
- Static images are losing ground fastest: image engagement dropped 17% year over year in 2025, while carousels held steady at 0.55%, per the same Socialinsider report.
- Reels win on conversation. Brand accounts with 100,000 to 1 million followers average 60 comments per Reel, compared with 40 on carousels and 38 on images, per the same benchmark data.
- Carousels win on saves and views: large brand accounts average 35,370 views per carousel, compared with 16,035 per Reel, per the same study.
- Follower growth is slowing at every size. Accounts with 1,000 to 5,000 followers grew 22% in 2025 (down from 38% in 2024), while accounts with 100,000 to 1 million followers grew 11.25%, per the same Socialinsider data.
- Brands now post about 8 Reels, 5 carousels, and 7 images a month, with Reels volume up 33% year over year, per the same report.
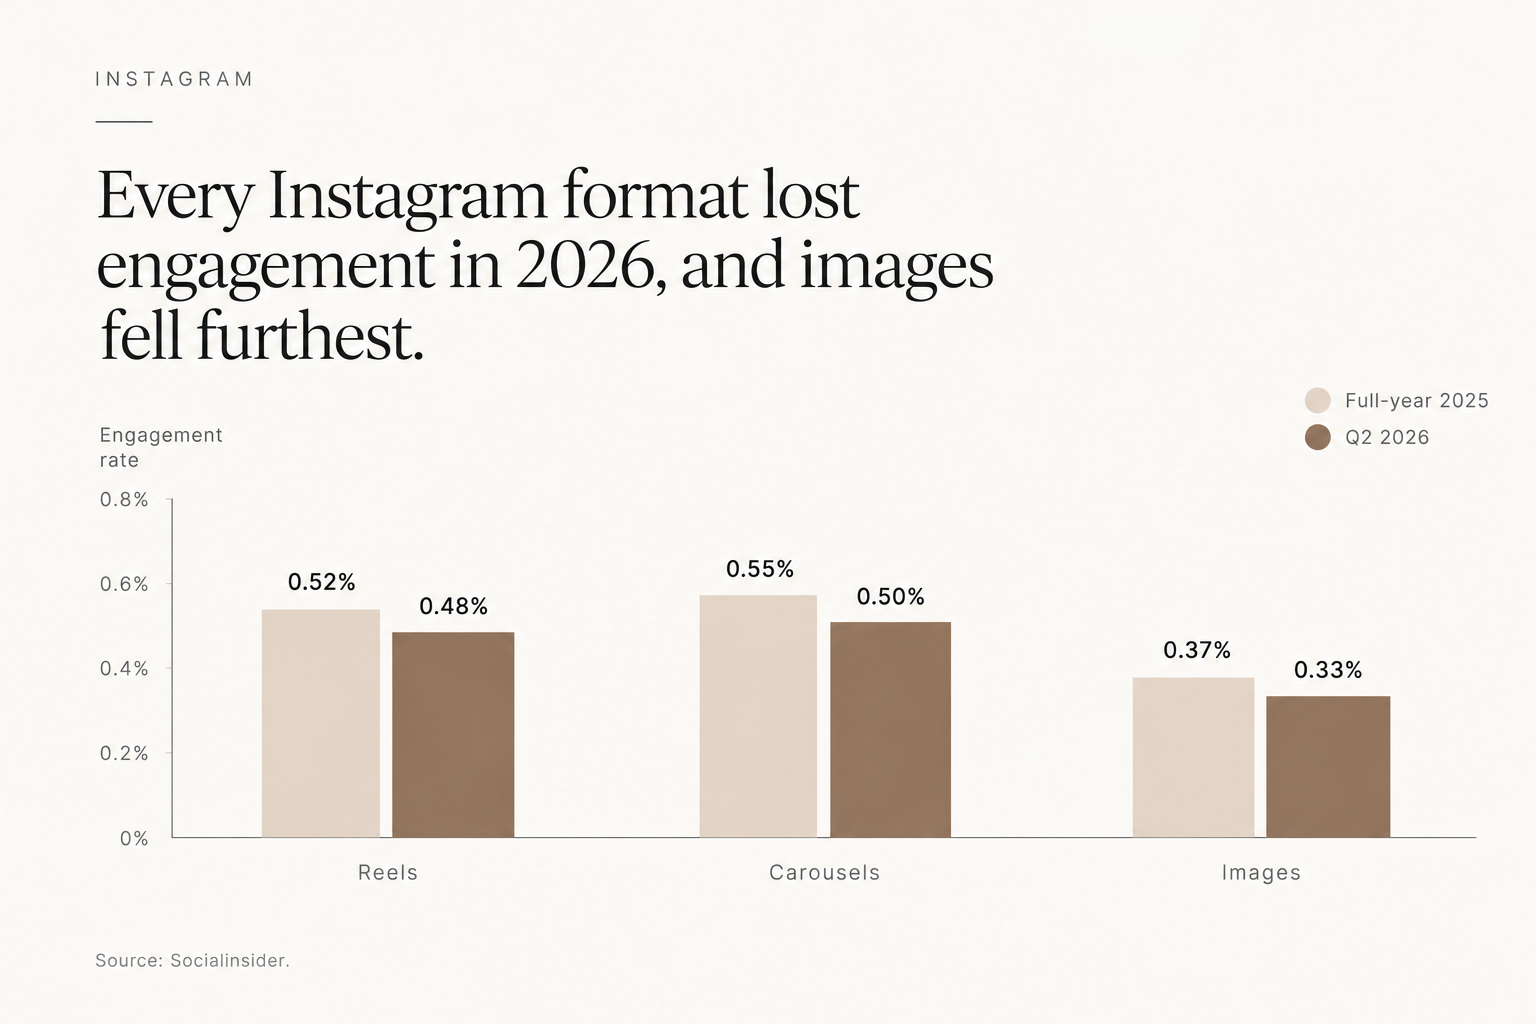
What this means: a "good" engagement rate on Instagram is lower than most older benchmarks suggest, and it keeps moving down. The practical takeaway is format mix: carousels for saves and reach, Reels for comments and discovery, and fewer standalone images. Measure your own rate against current quarterly benchmarks for your account size, since a 2021 benchmark will make almost any 2026 account look like it's underperforming.
Instagram Advertising Statistics: Reach, Costs, and ROI
eMarketer forecasts Instagram's US ad revenue at $37.13 billion for 2025, making it larger than Facebook's US ad business.
- Instagram's US ad revenue will reach $37.13 billion in 2025, up 15.9%, making it the largest social ad business in the US, according to eMarketer's forecast.
- Instagram also earns more per user than Facebook in the US, at about $223 per user compared with $191, according to eMarketer's December 2024 forecast.
- eMarketer projects Instagram's US ad revenue to reach $42.52 billion in 2026, or 53.1% of Meta's US ad revenue, according to Sprout Social's summary.
- 53% of Instagram ad placements ran on Reels in Q4 2025, according to Sensor Tower data reported by eMarketer.
- The average cost per click is about $3.35 for feed ads and $1.83 for Stories ads, according to WebFX's Meta benchmarks.
- Click-through rates stay modest: 0.22% to 0.88% for feed ads and 0.33% to 0.54% for Stories ads, per the same WebFX data.
- 48% of marketers say Instagram delivers the highest ROI of any social platform in 2026, according to HubSpot data in the same Sprout Social roundup.
- Meta's Reels business reached an annual revenue run rate of over $50 billion across Facebook and Instagram, according to Mark Zuckerberg on Meta's Q3 2025 earnings call.
What this means: Instagram's ad inventory is shifting toward Reels whether advertisers choose it or not, and Stories remain the cheaper click. The low CTR ranges point to Instagram's strength as a discovery channel, so creative quality and landing pages carry more of the conversion work than they do on search. Our Meta advertising team builds vertical-first creative for exactly this placement mix.
Instagram Reels Statistics
Reels accounted for 46% of time spent on Instagram in the US in 2025, up from 37% a year earlier.
- Reels took 46% of time spent on Instagram in the US in 2025, up from 37% in 2024, according to Sensor Tower data reported by CNBC.
- Meta's own figure is higher: Reels account for more than half of daily time spent on Instagram globally, according to figures Meta reported in October 2025.
- Reels are reshared 4.5 billion times a day, according to Hootsuite's roundup of Meta figures.
- Reels must be under 3 minutes long to be recommended to non-followers, per the same Hootsuite guide.
- The average Reel generated more than 90 shares and 475 likes in 2025, according to Statista data in the same Sprout Social roundup.
- 79% of weekly Reels users have bought a product or service after seeing it in a Reel, according to Sprout Social data cited by Neal Schaffer.
What this means: the two time-share figures disagree because they measure different things. Sensor Tower's 46% covers US users only and is estimated from outside the app, while Meta's "more than half" is a global internal figure. Both point the same way: Reels are now the main way people use Instagram. Our guide to Instagram Reels ads covers how to build for this placement.
Instagram Influencer Marketing Statistics: Rates, Tiers, and Engagement
Instagram hosted 40% of all influencer collaborations in 2025, more than any other platform.
- 40% of influencer collaborations in 2025 happened on Instagram, according to Collabstr's 2026 Influencer Marketing Report.
- Nano creators with 1,000 to 10,000 followers make up 81.5% of Instagram creators, micro creators 14.4%, and accounts over a million followers just 0.1%, according to HypeAuditor's 2026 State of Influencer Marketing report, as reported by eMarketer.
- Nano creators average 1.78% engagement, compared with 0.54% for creators with 10,000 to 50,000 followers and 0.33% for accounts past a million, per the same HypeAuditor data.
- Using a different method, eMarketer puts nano-influencer engagement at 6.23%, the highest of any tier, according to the same Sprout Social roundup.
- Average cost per Reel runs from $55 for nano creators to $300 for micro, $2,750 for mid-tier, $7,500 for macro, and $75,000 for mega-influencers, according to Sprout Social's influencer platform data in the same roundup.
- The average influencer post earned 1.36% engagement in 2025, with carousels highest (1.36%), Reels next (1.24%), and photos at 1.04%, per the same Sprout Social data.
- For new 2026 influencer budgets, TikTok leads: it appears in 31% of marketers' plans, more than double any other platform, according to the Influencer Marketing Hub 2026 Benchmark Report.
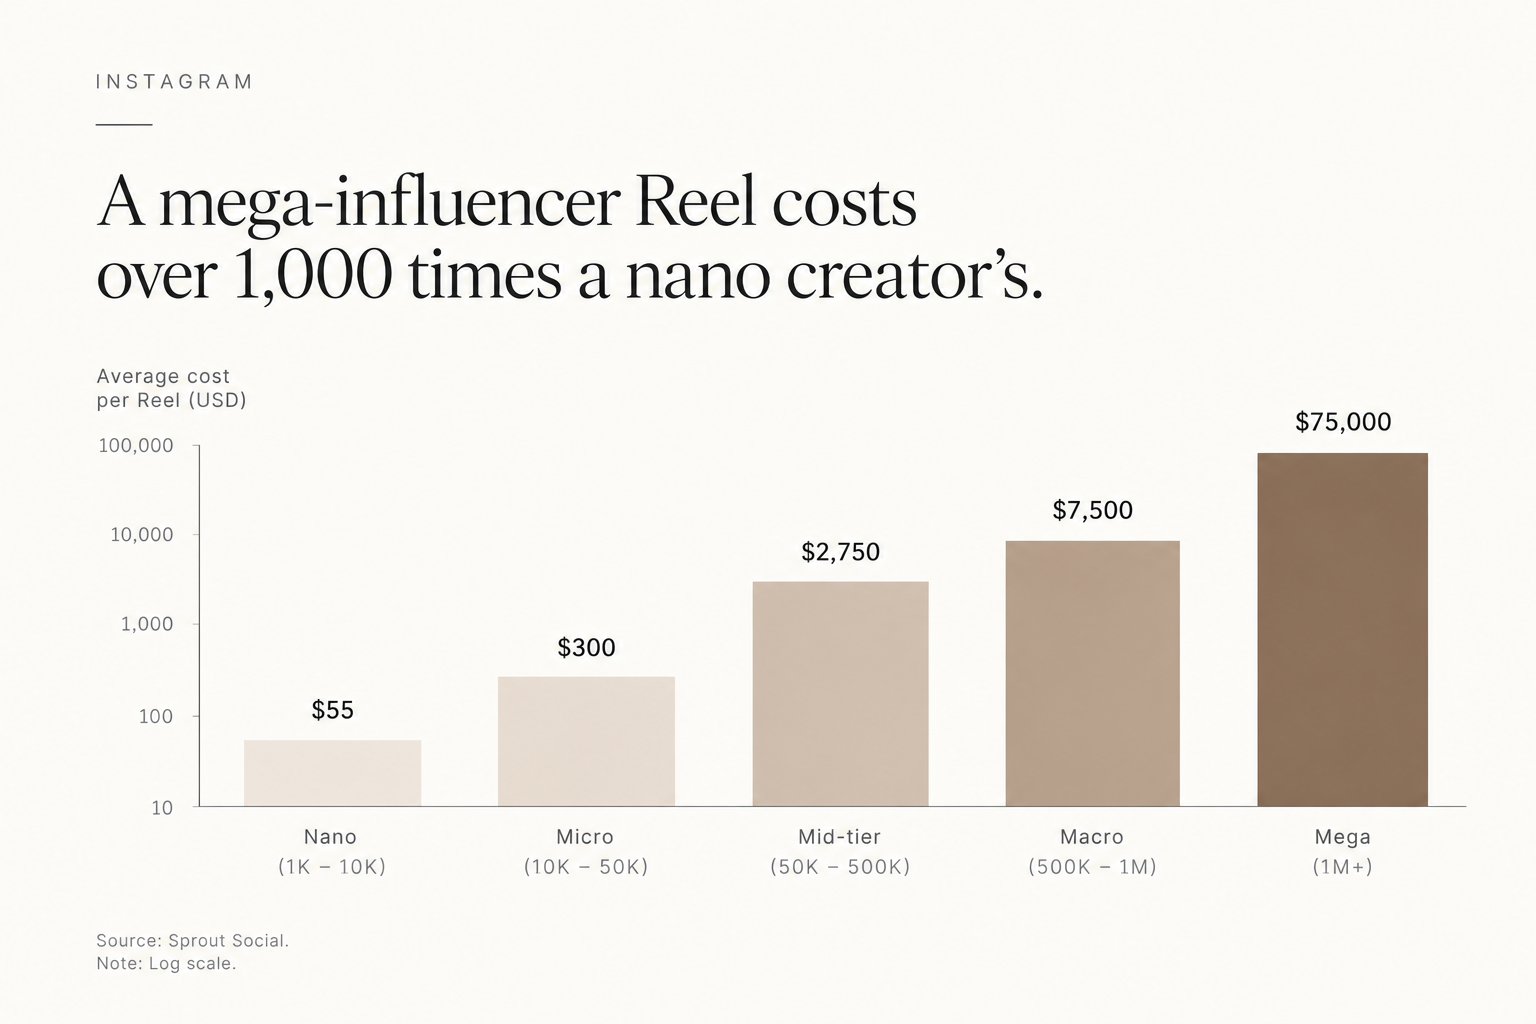
What this means: the nano-tier engagement numbers range from 1.78% to 6.23% because HypeAuditor and eMarketer calculate engagement over different samples and interaction types, so compare creators against the benchmark from the same source. Either way, smaller creators out-engage larger ones by a wide margin at a fraction of the cost.
In our own programs, a micro-influencer program for mental health app Mindbloom cast 15+ creators that went through the treatment. This led to a 40% increase in referral signups and a 25% CAC reduction.
Our micro-influencer agency and nano-influencer teams build programs around these tiers.
Instagram Marketing and Shopping Statistics for Brands
29% of social users make purchases on Instagram, and about 78% of social media marketers use the platform.
- 29% of users make purchases on Instagram, making it the third most-used social platform for buying, according to the 2025 Sprout Social Index.
- An estimated 47% of US social buyers will purchase through Instagram in 2026, according to eMarketer data cited by Hootsuite.
- 62.8% of Instagram users go there to follow or research brands, ahead of TikTok (56.2%) and Facebook (53%), according to GWI data in DataReportal's Digital 2026 report.
- 60% of consumers interact with brand content on Instagram at least several times a week, according to Sprout Social's 2026 Social Media Content Strategy Report, cited in the same Sprout Social roundup.
- About 78% of social media marketers use Instagram (85% of B2C and 71% of B2B marketers), according to Statista data in the same Sprout Social roundup.
- Around 70% of marketers plan to increase their Instagram investment in 2026, per the same Sprout Social research.
- About a quarter of consumers would choose Instagram over any other channel for customer care, according to the same Sprout Social report.
What this means: Instagram works as a research and discovery channel before it works as a checkout, and the GWI brand-research figure is the number to watch. Creator-style content made by our UGC agency is built for that research moment. For shopping-specific data across platforms, see our social commerce statistics.
Instagram Stories Statistics
More than 500 million people use Instagram Stories every day.
- More than 500 million people use Instagram Stories daily, according to Meta figures cited by Sprout Social.
- Accounts with 100,000+ followers post over 6x more Stories per month than smaller accounts, according to Socialinsider data cited by Hootsuite.
- Most Story exits happen after the first three Stories in a sequence, and exit rates rose slightly in 2025, per the same Socialinsider data.
What this means: Stories reward short sequences with the offer or link in the first three frames. For creative ideas, see our guide to animated Instagram Stories.
Instagram Usage Statistics: Time Spent and Daily Habits
The average Instagram user spends 1 hour and 13 minutes a day in the app.
- Users spend an average of 1 hour 13 minutes a day on Instagram, based on DataReportal's Digital 2026 analysis of Similarweb Android data.
- 65.4% of Instagram's Android users open the app every day, third among major apps behind WhatsApp and Facebook, per the same DataReportal data.
- 32% of Instagram users plan to spend more time on the platform in 2026, rising to 41% among Gen Z, according to Sprout Social.
- 20% of US adults regularly get news on Instagram, up from about 11% in 2020, according to Pew Research Center data cited by Hootsuite.
What this means: Instagram is a daily habit for most of its users, which rewards a steady posting rhythm over occasional bursts. Threads, Meta's text companion app, draws on the same audience; see our Threads adoption stats for its numbers.
Instagram vs TikTok Statistics: Reach, Time Spent, and Engagement
TikTok leads on time spent and ad reach, while Instagram leads on US adoption, brand research, and influencer volume.
- TikTok users spend 1 hour 37 minutes a day in the app, compared with 1 hour 13 minutes on Instagram, according to Digital 2026 data from We Are Social and Meltwater.
- TikTok's ad reach is now larger than Instagram's, at 2.21 billion users compared with Instagram's 1.99 billion, according to DataReportal's April 2026 figures summarized by PostEverywhere.
- Only 0.1% of Instagram users use no other social platform, and 54.5% also use TikTok, according to GWI data cited by Sprout Social.
- Among US adults, 50% use Instagram and 37% use TikTok, according to Pew Research Center.
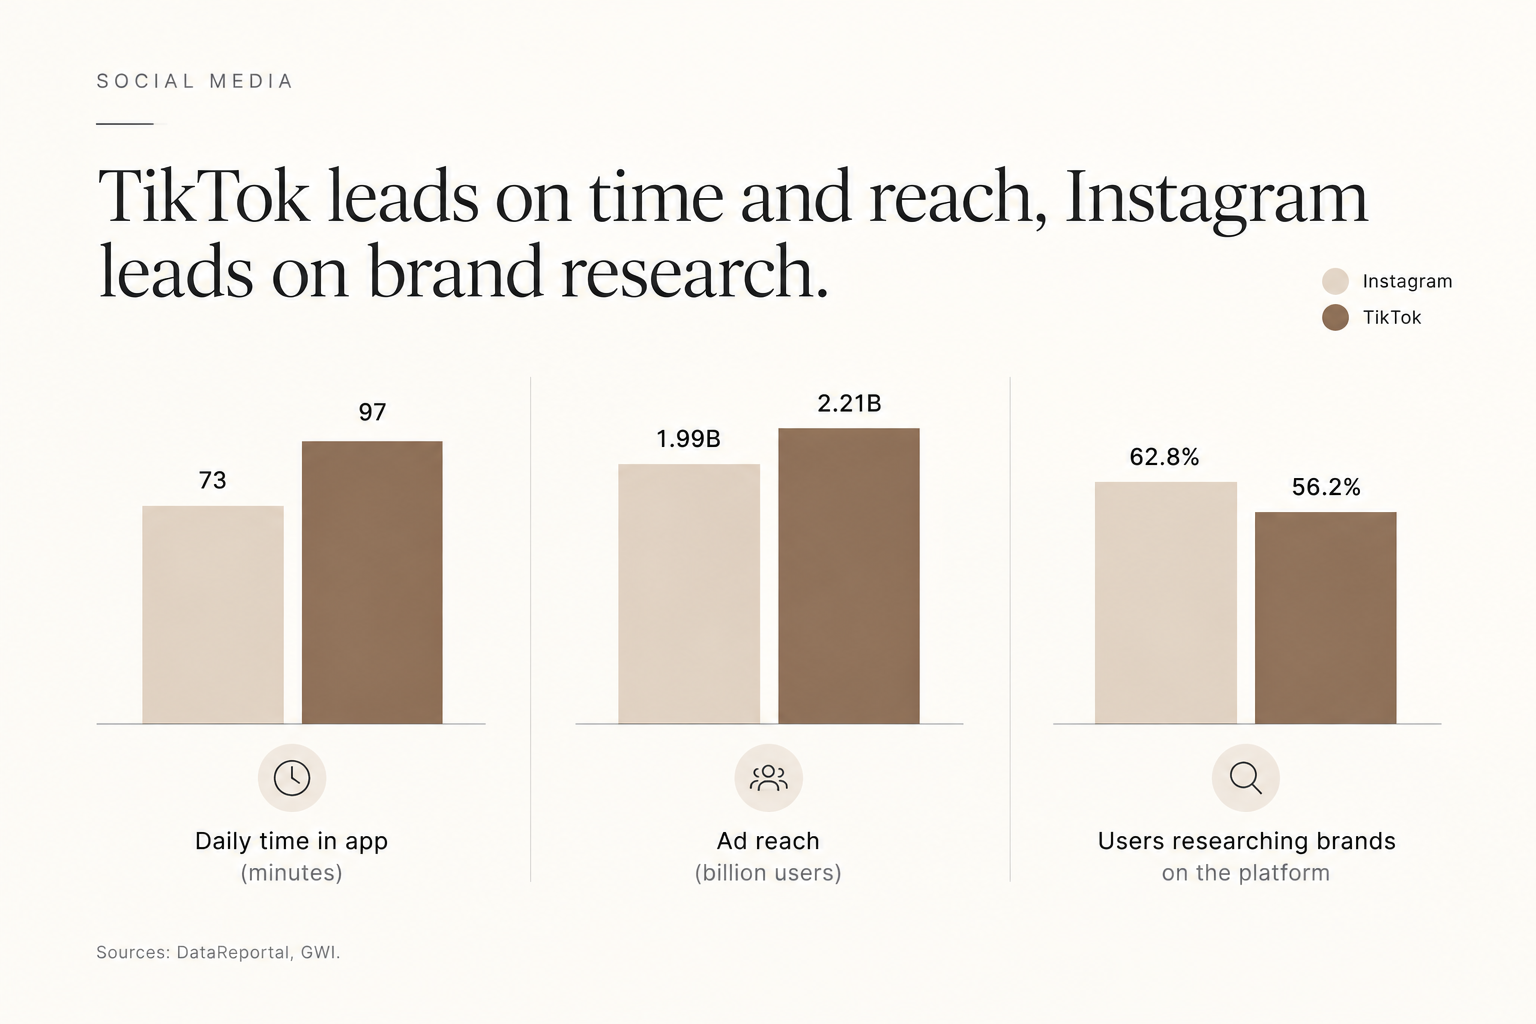
What this means: most brands are reaching the same people on both platforms, so the choice is about role more than audience. For the TikTok side of the comparison, see our TikTok statistics.
Instagram Revenue Statistics
Business of Apps estimates Instagram's 2025 revenue at $86.3 billion, about 44% of Meta's total.
- Instagram generated an estimated $86.3 billion in revenue in 2025, up from $66.9 billion in 2024 and $49.8 billion in 2023, according to Business of Apps estimates.
- That equals roughly 43.8% of Meta's total revenue, up from 3.4% in 2015, per the same Business of Apps data.
- Meta does not break out Instagram revenue in its earnings, so these figures are third-party estimates, per the same source.
What this means: the Business of Apps global revenue estimate and eMarketer's US ad revenue figure measure different things, one worldwide total revenue and one US advertising only, so they aren't comparable. For Meta's reported figures, see our Meta statistics.
How to Use These Instagram Statistics in Your Strategy
- Check the audience fit first. Compare Pew's US age and income splits, or DataReportal's country data, against your customer profile before setting a budget.
- Benchmark against current data. Use Socialinsider's quarterly rates for your follower bracket; engagement figures from 2021 or earlier no longer paint a correct picture.
- Rebalance your format mix. Shift single images into carousels, and give Reels a dedicated production lane since they now take close to half of time spent.
- Price creators by tier. Use the per-Reel rate ranges above to size a creator program, and weigh nano and micro creators against one larger name.
- Plan paid creative for Reels and Stories. More than half of ad placements now run on Reels, and Stories deliver cheaper clicks.
If you'd like help turning these numbers into a plan, book a strategy call with our team. We'll review your current Instagram performance against these benchmarks and outline a creator and paid social plan for the next quarter.
How We Sourced These Statistics
We prioritized platform data (Meta), independent research (Pew Research Center, DataReportal), named annual and quarterly reports (Socialinsider, Sprout Social Index, Influencer Marketing Hub, HubSpot), and established industry publications that attribute figures to a named original source. Vendor research is labeled as such. Where two sources disagree, the section notes explain why. Every figure is dated 2025 or later unless the text states otherwise, and the country table uses DataReportal's January 2025 ad audience data, the most complete country-level breakdown available.
Instagram Statistics FAQ
Is Instagram growing or declining in 2026?
Instagram's user base is still growing: it reached 3 billion monthly users in September 2025, a billion more than in 2022. Organic engagement per post is declining, down 24% in 2025 according to Socialinsider, because more content competes for the same attention. Growth in users and decline in engagement are happening at the same time.
Why do Instagram user numbers differ so much between sources?
Meta reports monthly active users (3 billion), DataReportal reports ad reach from Meta's tools (1.99 billion), and many blogs quote daily active user estimates that Meta no longer publishes. Ad reach excludes accounts advertisers can't target and can include duplicate or business accounts, so it isn't a count of people.
How should brands read engagement rate benchmarks when their accounts are much larger or smaller than average?
Compare within your follower bracket. Socialinsider's data shows follower growth and interactions change sharply between 1,000 and 1 million followers, and creator data from HypeAuditor shows engagement falling from 1.78% for nano accounts to 0.33% for accounts past a million.
Do nano-influencer engagement rates hold up in paid campaigns?
Not always. When creator content is run as ads, cost per acquisition and click-through rate matter more than the creator's organic engagement, so test creators on those metrics before scaling a tier.
Is Instagram or TikTok the better platform for new influencer budgets?
Instagram still hosts the most influencer collaborations (40% in 2025, per Collabstr), but TikTok leads new 2026 budget plans according to the Influencer Marketing Hub. Many brands use Instagram to scale creator content that has already proven itself and TikTok to test new concepts.