.svg)
.svg)
.svg)
.svg)


.svg)





Most UGC statistics pages recycle the same dozen numbers from a 2019 survey, and most of those numbers no longer have a source you can open.
This page is built differently.
Every statistic below links to the organization that produced it, names the report, and carries its date, so you can quote it in a deck without a footnote you cannot defend. The numbers come from Meta, TikTok, the IAB, Deloitte, Edelman, Kantar, HubSpot and the consumer-research teams at Bazaarvoice, PowerReviews and Yotpo, and they cover trust, purchase influence, on-site conversion, paid-social performance, budgets, generations and the AI question.
P.S. If you would rather skip the sourcing and go straight to creator ads that convert, our UGC agency produces and tests them for brands like Hurom and NielsenIQ.
TL;DR: What are the most important UGC stats for 2026?
- 19% lower cost per acquisition and 13% higher click-through rates are what advertisers saw on average after adding Partnership Ads (creator content run as ads) to business-as-usual campaigns, according to Meta's A/B tests across roughly 2,400 advertisers (December 2025).
- $37 billion is the IAB's projection for US creator-economy ad spend in 2025, up 26% year on year and growing about four times faster than total media (IAB Creator Economy Ad Spend & Strategy Report, November 2025).
- +43% conversion rate, +142% engagement rate and +30% completion rate is what TikTok measured for Spark Ads built on creator content versus standard in-feed ads (TikTok for Business, Return on Influence report, January 2025).
- 83% of consumers say they see the influencers or creators they follow as trusted sources of information, per Deloitte Digital's 2025 State of Social survey of 1,000 US consumers (May 2025).
- 65% of global shoppers rely on ratings, reviews, photos and videos from other consumers when deciding what to buy, according to Bazaarvoice's Shopper Experience Index Volume 18, a Savanta survey of 8,000+ consumers (November 2024).
- 77% of brands now repurpose creator content in paid ads, and 67% write usage rights into the creator's initial contract, per Aspire's State of Influencer Marketing 2026 survey of about 900 marketers and creators (March 2026).
- 32% of consumers say AI-generated marketing content makes them trust a brand less, while 61% are neutral, according to Klaviyo's 2026 AI Consumer Trends Report, a survey of 8,000 consumers in eight countries (December 2025 fieldwork).
One thing before the numbers.
We treat creators as a creative engine rather than a reach channel: their job is to supply a steady stream of native, testable ad concepts with borrowed trust built in, and media buying is the laboratory where those concepts prove themselves against a CPA. Read the statistics below through that lens. The trust and purchase-influence numbers explain why creator content earns attention; the platform data from Meta and TikTok explains what happens when you put paid distribution behind the concepts that win. The gap between the two is where most UGC programs leak money.
What does UGC stand for?
UGC stands for user-generated content: photos, videos, reviews and posts about a brand made by people and not by the brand itself.
In 2026 the term covers two different things:
- Organic UGC is what customers post on their own.
- Creator-made UGC is content a brand commissions from independent creators to look and feel native, then runs as paid ads (Meta calls these Partnership Ads; TikTok calls them Spark Ads).
Here’s one example from our Genomelink campaign:
Most of the performance statistics on this page describe the second kind, because that is where the platform data lives and where the money is spent. If you need a primer on producing it, start with our guide on how to create UGC ads.
UGC and consumer trust in 2026
- 88% of global consumers trust recommendations from people they know more than any other channel, according to Nielsen's Trust in Advertising study of 40,000+ respondents, still the largest study of its kind.
- 80% of people trust the brands they use, more than they trust business, media, government or NGOs, per the 2025 Edelman Trust Barometer Special Report on Brand Trust, 15,000 respondents in 15 countries.
- 73% of people say their trust in a brand would increase if it authentically reflected today's culture, in the same Edelman 2025 brand-trust report.
- 86% of consumers are more likely to trust a brand that publishes content from real customers than one that publishes influencer content, and 90% would rather see customer content than influencer content, per EnTribe's survey of 1,000+ US consumers.
- 43% of shoppers trust creators who share both pros and cons of a product, and 44% lose trust when a creator refuses to mention flaws, according to Bazaarvoice's Shopper Preference Report 2025, 8,000+ consumers in six countries.
- 98% of consumers agree that "authentic" images and videos are central to establishing trust in a brand, per Getty Images' VisualGPS research across 30,000+ adults in 25 countries.
- Authentic, non-promotional content is the number one thing consumers say they do not see enough of from brands on social, according to the 2025 Sprout Social Index of 4,044 consumers.
- 42% of consumers trust online reviews as much as personal recommendations in 2025, down from 79% in 2020, per BrightLocal's Local Consumer Review Survey.
What this means. Trust in peers is intact; trust in polished review content is eroding fast, and the BrightLocal drop from 79% to 42% in five years is the number to watch. The Bazaarvoice pros-and-cons finding is the practical takeaway: creator briefs that forbid any negative are producing content shoppers discount on sight. In our own creative testing, the scripts that name a real trade-off outperform the ones that read like a spec sheet, and the platform data further down explains why.
How UGC influences purchase decisions
- 65% of global shoppers rely on UGC such as ratings, reviews, photos and videos in their buying decisions, per Bazaarvoice's Shopper Experience Index Volume 18.
- 82% of consumers say they would be more inclined to buy from a brand that uses user-generated content in its marketing, per EnTribe's US consumer survey.
- 71% of consumers say they make a purchase within a couple of days of seeing creator content across Meta's apps, according to Meta for Business.
- 61% of consumers discovered a new brand or product on social media in the past 12 months, per Deloitte Digital's 2025 State of Social.
- 46% of consumers say customer reviews make them more likely to buy a product on a social platform, second only to deals and discounts at 62%, in the same Deloitte Digital 2025 research.
- 81% of consumers say social media compels them to make spontaneous purchases multiple times a year or more, according to the 2025 Sprout Social Index.
- 54% of consumers always or regularly research photos or videos of real people using a product before buying it, per Emplifi's Impact of UGC report (2024).
What this means. Discovery happens in the feed and the purchase happens within days, which is the strongest argument for running creator content as paid media instead of hoping it travels organically. The Deloitte finding that reviews rank second only to discounts as a purchase trigger on social is worth reading twice: social proof in the ad itself is doing the work a promo code used to do, at a lower margin cost.
That’s why we create UGC like this from our Dashing Diva campaign:
UGC conversion rate uplift on e-commerce sites
- 161% higher conversion rate is the e-commerce average lift from displaying UGC on product pages, rising to 207% in apparel, according to Yotpo's analysis of 200,000+ stores and 163 million+ orders.
- More than 55% of online buyers engage with reviews, customer photos or Q&A before purchasing, in the same Yotpo dataset.
- 95% of consumers regularly read product reviews as part of their shopping journey, per a PowerReviews survey of 21,279 consumers.
- Only 43% of consumers would buy a product with zero ratings or reviews, according to the same PowerReviews survey of 21,279 consumers.
- 78% of consumers find photos from other consumers more valuable than visual content from brands, retailers or influencers, per PowerReviews' 2025 research.
- Nearly $8 billion in annual revenue is attributed to UGC across Emplifi's social-commerce clients, and shoppers who engage with UGC show 4.9x more repeat visits, per Emplifi's Impact of UGC report cited above.
- 96% of consumers read online business reviews at least sometimes, with only 4% saying they never do, according to BrightLocal's Local Consumer Review Survey.
What this means. The on-site numbers are the easiest UGC wins and the most under-measured. Yotpo's 161% is a vendor figure across its own stores, so treat it as an upper bound, but the direction is consistent across every dataset here: pages with customer evidence convert, pages without it lose shoppers who then go read reviews elsewhere. A brand running paid social to a product page with no UGC is paying for the click twice.
Creator ads vs brand ads: what the platforms measure
- 19% lower CPA and 13% higher CTR on average is Meta's result for adding Partnership Ads to business-as-usual campaigns, from A/B tests across roughly 2,400 advertisers.
- 7.5% higher offsite conversion rate and 9.6% higher offsite click-through rate is what Meta reports for Partnership Ads that feature a creator testimonial versus business-as-usual ads.
- +43% conversion rate, +142% engagement rate and +30% completion rate is TikTok's measured lift for Spark Ads built on creator or user content versus standard in-feed ads.
- 87% of the top 200 highest-spending Spark Ads campaigns on TikTok involve creators, per the same TikTok report.
- +165% more comments on performance ads and +84% on brand ads is the engagement lift TikTok measured for creator-produced assets versus non-creator assets).
- 67% higher video-through rate is what creator-made ad assets achieved on TikTok compared with assets made without creator tools, outside the Spark Ads format.
- 48% of social-first brands say creator partnerships deliver the highest ROI of any social tactic, against 38% of low-maturity brands, per Deloitte Digital's 2025 survey of 390 director-level marketers at $500M+ B2C companies.
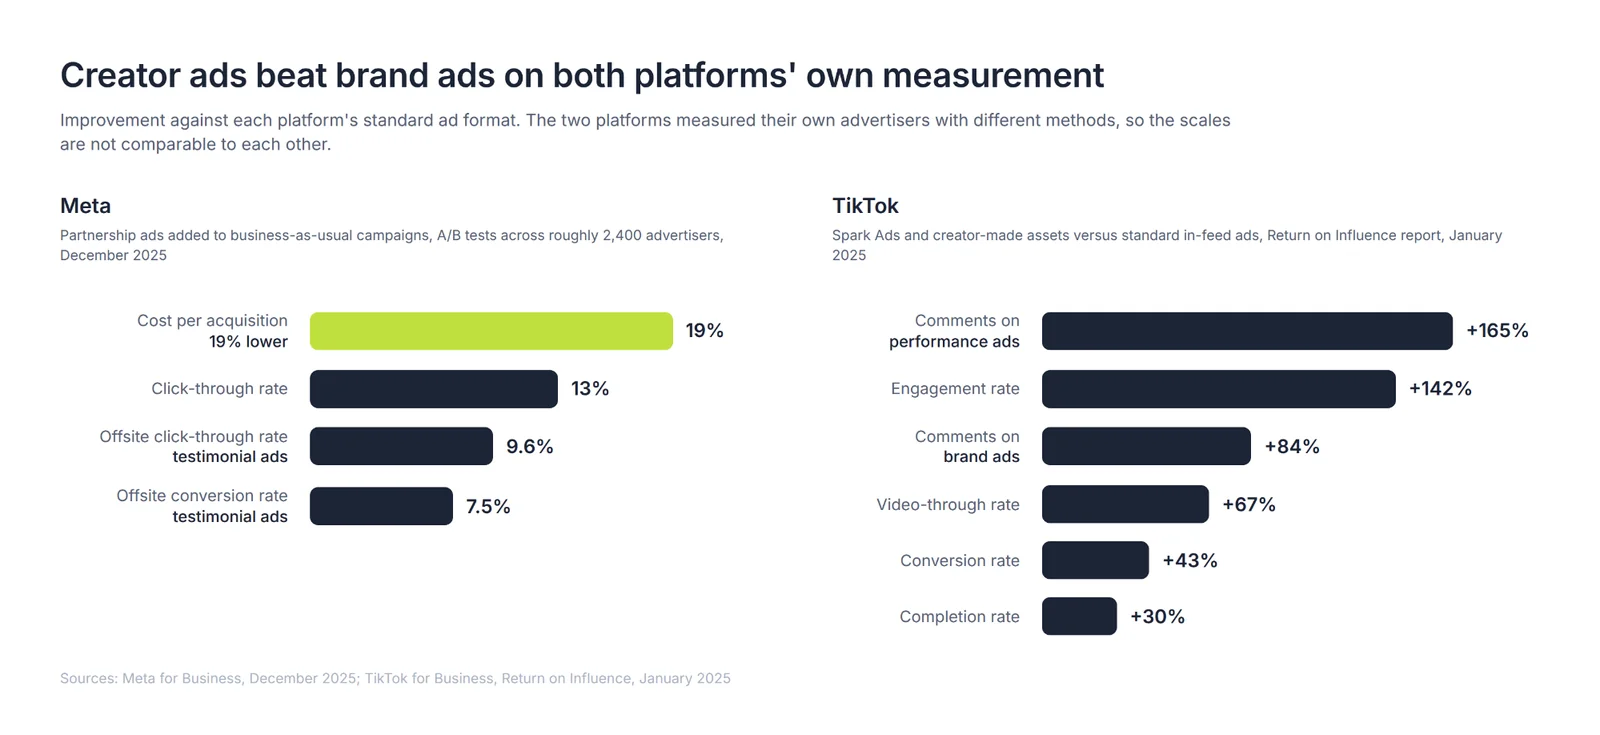
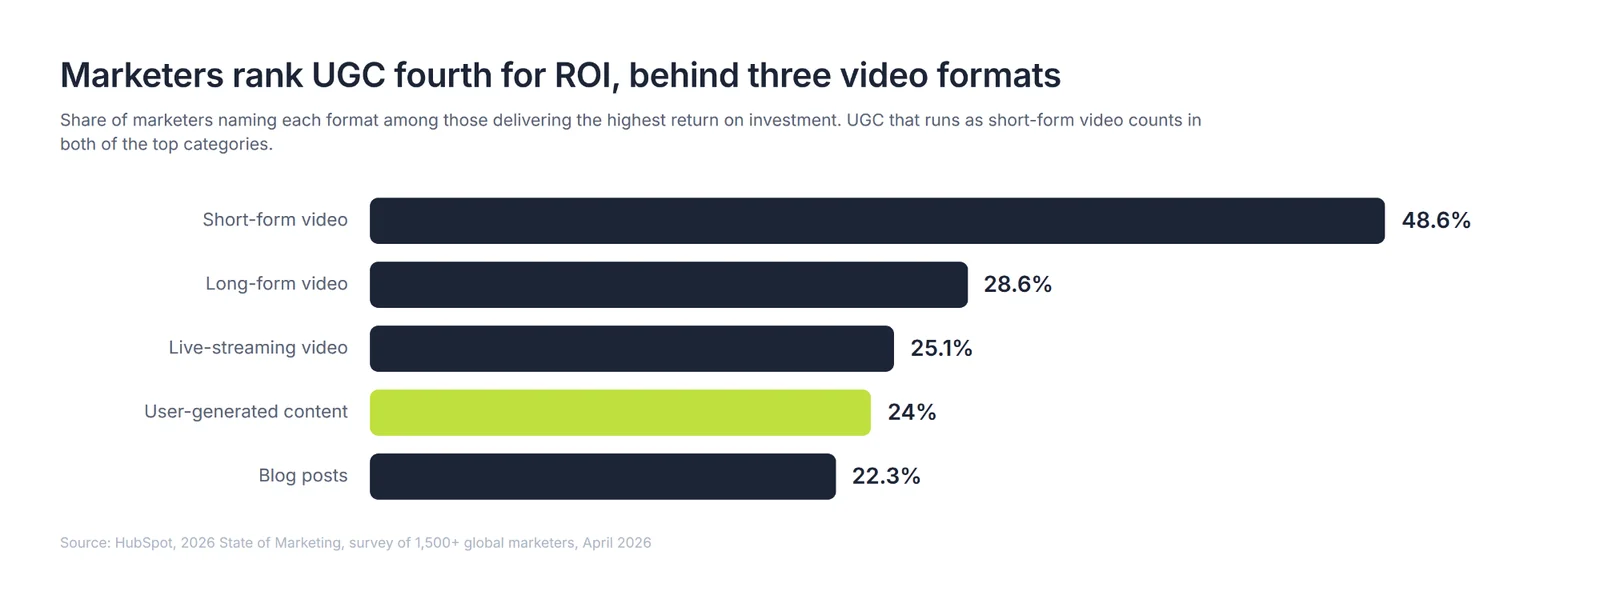
What this means. These are the numbers a CFO should see, because they come from the platforms' own measurement rather than from a survey of marketers' feelings. Two details matter. Meta's 19% CPA improvement came from adding creator ads alongside brand ads, not replacing them, which is the mix we run by default. And HubSpot's ranking puts UGC fourth for ROI behind three video formats, which is less a verdict on UGC than a reminder that UGC on TikTok and Reels is short-form video, and static customer photos are not.
Pro tip: If you want the mechanics of testing creator concepts before spending, our guides on TikTok Spark Ads, dark posting for creator content and A/B testing UGC ads cover the workflow.
Our performance creative team runs exactly this loop: creators supply concepts, media buying tests them, the winners get the budget.
How much do brands spend on creator content and UGC?
- $37 billion is projected US creator-economy ad spend for 2025, a 26% year-on-year increase and about 4x the growth rate of total media, per the IAB's 2025 Creator Economy Ad Spend & Strategy Report with Advertiser Perceptions.
- $13.9 billion to $29.5 billion is how much US creator ad spend grew between 2021 and 2024, more than doubling in three years, according to the IAB.
- 48% of ad buyers now consider creators a "must buy" channel, behind only social media and paid search, per the IAB.
- 40% of buyers rank overall ROI as their top KPI for creator campaigns, and the leading campaign goals are brand awareness (43%), reaching new audiences (41%), trust (35%) and online sales (32%), according to the IAB.
- 24% of total social media budget went to creators on average in 2024, making them the top budget priority for the large B2C brands Deloitte Digital surveyed.
- 61% of marketers globally expect to increase their influencer and creator content budgets in 2026, per Kantar's Media Reactions 2025 study of 974 senior marketers and 21,300 consumers in 30 markets.
- 74% of marketers plan to increase influencer marketing budgets in 2026, according to Aspire's State of Influencer Marketing 2026.
- 50% of brands already working with UGC creators plan to expand that budget and 0% plan to reduce it, while 31% rank UGC ads as a highly effective format, per Influencer Marketing Hub's 2026 Benchmark Report of 600+ marketers.
- Only 21.2% of brands say they use influencer marketing at all (23.6% of B2C, 18.6% of B2B), according to HubSpot's 2026 State of Marketing.
- Nearly $3 billion is what Facebook paid creators through its monetization programs in 2025, up 35% year on year and its highest annual total, per Meta.
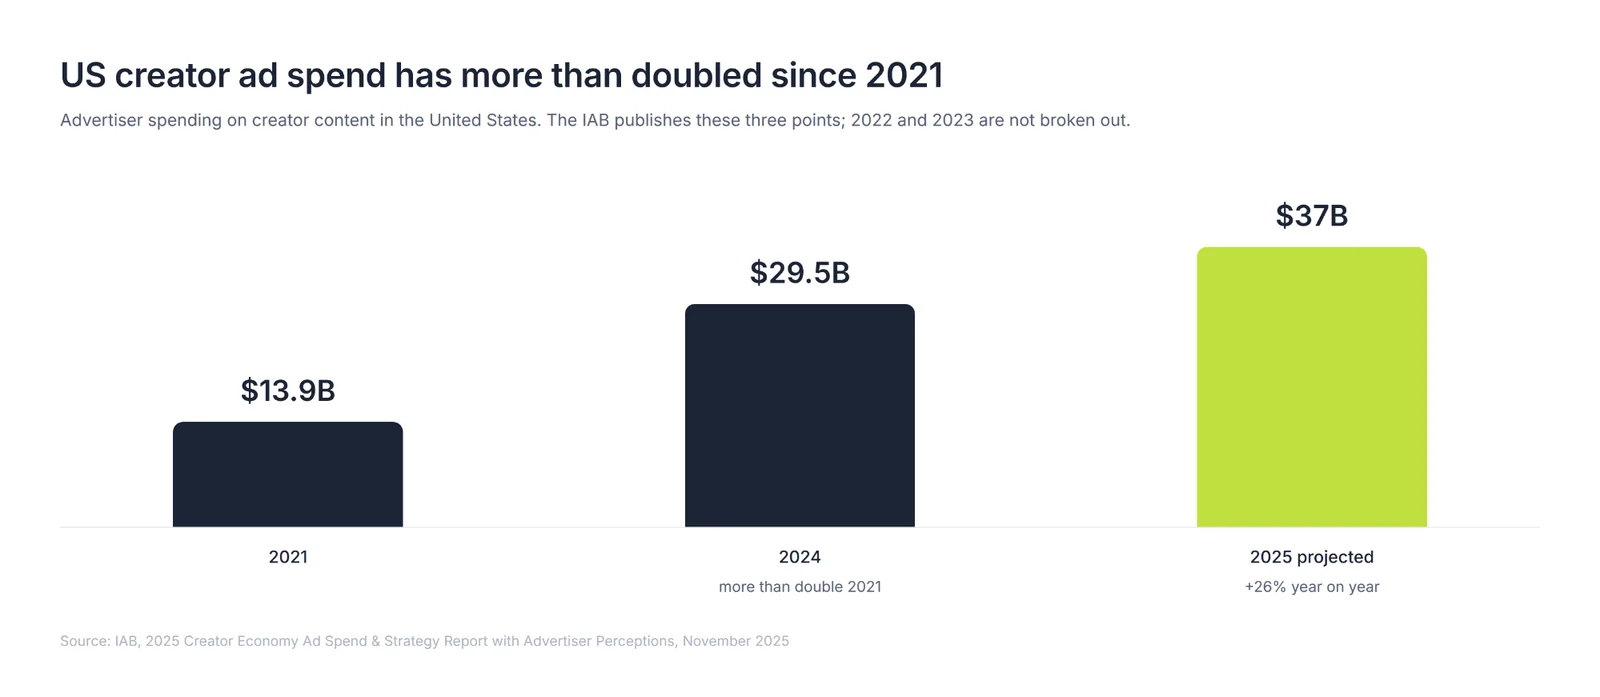
What this means. Spend is compounding at four times the market while adoption sits at a fifth of brands, which is the definition of an early market with a first-mover window still open. The IAB's finding that 40% of buyers put ROI first, while the top stated goal is awareness, describes the tension we see in most briefs.
Further Reading: For creator counts and total market size, see our creator economy statistics.
Gen Z, millennials and UGC
- 80% of Gen Z say user-generated content is critical to their purchase decisions, per Bazaarvoice's Shopper Experience Index Volume 18.
- 56% of shoppers aged 18 to 34 have bought something based on a creator's recommendation, compared with 11% of shoppers aged 55 and older, according to Bazaarvoice's Shopper Preference Report 2025.
- 76% of Gen Z are open to hearing about brands through creator content on Meta's apps, per Meta for Business.
- 53% of Gen Z shoppers are suspicious of perfect five-star ratings, versus 46% of shoppers overall, per PowerReviews.
What this means. Shoppers under 35 buy from creators at five times the rate of shoppers over 55, and that ratio, more than any engagement number, is the generational gap. The PowerReviews five-star suspicion is the detail brands miss: the same audience that trusts creators most is the one most alert to anything that looks curated. Real product moments, imperfect settings and creators matched by persona rather than follower count are what survive that scrutiny, which is why our micro-influencer sourcing filters on audience fit before reach.
AI-generated UGC vs human UGC
- 32% of consumers say AI-generated marketing content makes them trust a brand less, and 61% are neutral, per Klaviyo's 2026 AI Consumer Trends Report of 8,000 consumers in eight countries.
- Two in three Americans want humans rather than AI creating marketing content, and three in four say the same for news and entertainment, according to the Ipsos Consumer Tracker of 1,085 US adults.
- Over 60% of US consumers worry that generative AI could lead to fake or misleading advertisements, per Kantar's US Media Reactions 2025.
- 95% of advertisers have concerns about using AI in creator marketing, according to the IAB's 2025 Creator Economy report.
- 132% higher completion rate, 53% higher CTR and 48% higher CVR is what TikTok measured for Spark Ads assets supported by its AI tools versus non-AI assets, according to 2025 data from TikTok for Business.
What this means. The consumer numbers and the platform numbers point in different directions, and both are true. AI-assisted editing, captions and variations lift performance on TikTok's own data; fully synthetic "people" carry a trust penalty a third of consumers will apply the moment they notice. Our position, laid out in AI UGC ads vs real UGC, is to use AI to multiply a real creator's winning concept into variations, and never to replace the creator.
UGC & SEO / AI Overviews
- 61.7% vs. 41.6% is the citation-rate gap between pages using Product/Review schema with populated attributes versus generic schema .
- Brands cited in AI Overviews get 35% higher CTR versus brands that aren't.
- 48% of citations in AI search now come from user-generated and community sources rather than brand-owned pages.
What this means: citation is starting to matter more than raw ranking, and UGC/reviews are disproportionately what gets cited over brand-created content. That’s why we advise you to use schema markup on review content.
UGC Stats About Social & Live Commerce
- $64.3 billion in global GMV for TikTok Shop in 2025, up 94% year-over-year across 16 markets, with the US alone contributing $15.1 billion on 68% growth.
- Only 12% of consumers have ever participated in a livestream shopping event, even as Gen Z and Millennials increasingly treat it as a form of entertainment as much as a purchase channel.
- At least 79% of Gen Z and Millennial consumers integrate social media into their shopping journey, per the same Bazaarvoice report cited above.
- 108.3 million Americans are estimated to shop through social media in 2025, a 6.8% increase that puts social buyers at 47.9% of all US social network users.
- 51% of social buyers in the US will shop on TikTok specifically in 2026, ahead of Instagram at 47.2% and Pinterest at 20%.
- Nearly 46% of shoppers find short-form video (TikTok, Reels, YouTube Shorts) the most influential format for purchase decisions, per the same Bazaarvoice report cited above.
- Video commerce now accounts for roughly ~25% of GMV across Southeast Asia's $185 billion ecommerce market.
What this means. Live/social commerce is accelerating fast on a growth-rate basis, but the 12% livestream-participation figure sitting next to the GMV numbers shows US adoption is still early relative to Asia; the growth rate and the participation rate are telling two different parts of the same story, and one shouldn't be read as proof of the other. TikTok's 51% share of US social buyers is worth watching specifically, since it's pulling ahead of Instagram and Pinterest fast enough to change which platform gets the UGC production budget first.
ROI of UGC
- Featuring UGC increases 154% higher revenue per visitor, compounding on top of the conversion-rate lift the same content drives.
- AI-assisted UGC production runs ~73% cheaper than traditional creator video — under $20 per asset versus $150-500.
- Bazaarvoice's platform delivered a 400% ROI, a $4 return per $1 spent, per a Forrester Total Economic Impact study.
- A separate Forrester study found a 30% productivity gain on content operations, plus a multi-million-euro sales lift, for its composite enterprise organization (commissioned by Skeepers in September 2024).
What this means. The clean, current, conversion-side numbers (the 154% revenue-per-visitor lift specifically) are the strongest evidence of using UGC as a tactic.
UGC in Email
- 31% of brands and retailers feature social content from fans and influencers in email marketing.
- Adding an exclamation point to review-request subject lines led to 27% fewer reviews collected, while a question mark increased reviews by up to 23%, according to Yotpo.
- 19.2% of marketers say they plan to add user-generated content to their email marketing strategy.
- Almost two thirds (64%) of a brand's review volume comes from post-interaction emails sent after purchase.
What we see in our own UGC campaigns
Platform benchmarks describe averages. These are published results from inBeat client campaigns where creator content was the creative engine and paid social was the distribution:
- 300% ROAS growth and a 65% reduction in overall CPA for Hurom, after shifting from always-on discounting to health-led messaging and running iterative UGC creative tests on hooks, CTAs and social proof.
- 73% decrease in CAC and 124% increase in registration completion for Genomelink, with a pipeline of five to ten performance UGC videos always in production to stay ahead of creative fatigue.
- 75% reduction in CPA and 100k+ downloads a month for Unroll.me, where the media-buying strategy was built on a scalable UGC pipeline.
The common thread is volume plus testing: enough creator concepts to find the winners, and a media team reading the results weekly so the next brief is sharper than the last.
Build a UGC program that earns its numbers with inBeat
The statistics above make a consistent case. Shoppers trust people over brands, discovery happens in the feed, creator ads outperform brand ads on the platforms' own measurement, and spend is growing four times faster than the market while most brands have not started.
The part the statistics cannot do for you is the operating system: sourcing creators matched to your buyer, briefing them for believability, testing concepts in paid before committing budget, and refreshing before fatigue sets in.
That is what our UGC agency does for brands on Meta and TikTok.
Book a strategy call. We will look at your current creative mix, show you which of these benchmarks your account should be beating, and map a 90-day creator testing plan.
How we sourced these statistics
Every number on this page was checked against the page where the organization that produced it published it, on September 1, 2026.
We use:
- Platform data (Meta, TikTok)
- Industry bodies and measurement firms (IAB, Kantar, Ipsos, Nielsen)
- Big Four research (Deloitte Digital)
- Named annual reports with a stated method (Edelman Trust Barometer, HubSpot State of Marketing, Sprout Social Index, Influencer Marketing Hub Benchmark Report, Getty Images VisualGPS)
- Vendor research labelled as such (Bazaarvoice, PowerReviews, Yotpo, Emplifi, Aspire, Klaviyo, BrightLocal, EnTribe)
We excluded other statistics roundups, undated figures, and anything older than three years unless it remains the primary source of a number the industry still uses, which is why Nielsen's 2021 trust study appears and its 2012 predecessor does not.
Of the 50 statistics on the previous version of this page, 44 were cut or replaced because their origin could no longer be verified or was more than three years old.
If a link breaks or a publisher updates a figure, email us and we will correct it.
FAQ
What are the UGC stats for 2026?
The 2026 numbers that matter most for brands come from the platforms and the industry bodies: Meta reports 19% lower CPA and 13% higher CTR when Partnership Ads are added to standard campaigns; TikTok reports +43% conversion rate for creator-based Spark Ads; the IAB projects $37 billion in US creator ad spend for 2025, growing 26% a year; and Deloitte Digital finds 83% of consumers treat the creators they follow as trusted information sources. The answer block at the top of this page lists seven with their sources and dates.
What's a good rate for UGC?
A good UGC rate depends on the deliverable, the creator's track record and the usage rights attached, and it is a pricing question rather than a statistics question. Our UGC rates guide publishes current price ranges by video type and includes a calculator; our UGC usage rights guide covers the licensing terms that move the price.
Is UGC oversaturated?
The audience data says no and the format data says partly. Consumer trust in creators remains high (83% per Deloitte Digital, 2025) and shoppers still rank reviews as the top purchase factor (96% per PowerReviews, 2025). What has saturated is the template: the scripted testimonial, the perfect five-star review and the AI-generated spokesperson, all of which now carry measurable trust penalties. UGC that names a trade-off, shows real use and comes from a creator whose audience matches the buyer is not saturated, because it is harder to produce.
Can you really make money with UGC?
For brands, the return shows up as lower acquisition cost and higher conversion when creator content is run as paid media, as the Meta, TikTok and inBeat client figures above show. For creators, UGC is paid content production for brands, priced per deliverable rather than per follower, and inBeat works with independent creators through its creator application.
How do you measure UGC performance?
Measure creator content the same way you measure any acquisition asset: cost per acquisition, return on ad spend and hook rate at the creative level in paid social, and conversion rate lift on product pages that display customer content versus pages that do not. Treat engagement rate on organic posts as an early signal and nothing more. Our influencer marketing ROI guide covers the formulas, attribution windows and holdout methods.