


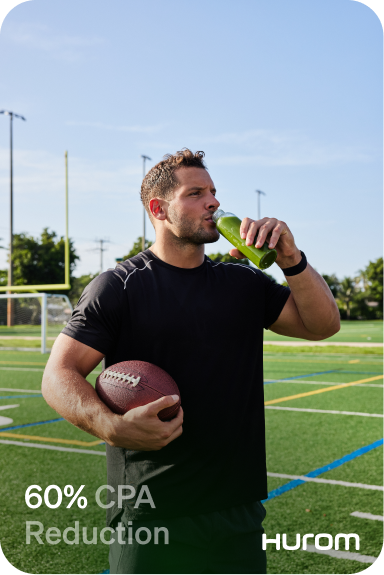
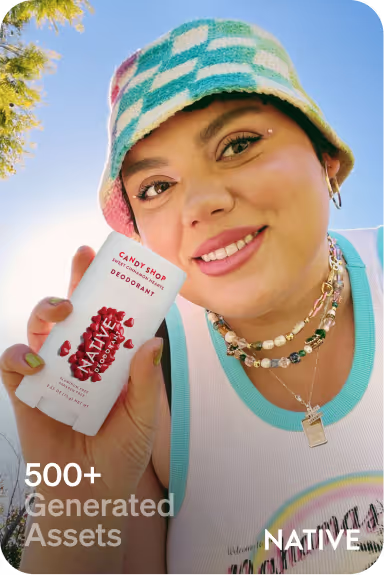
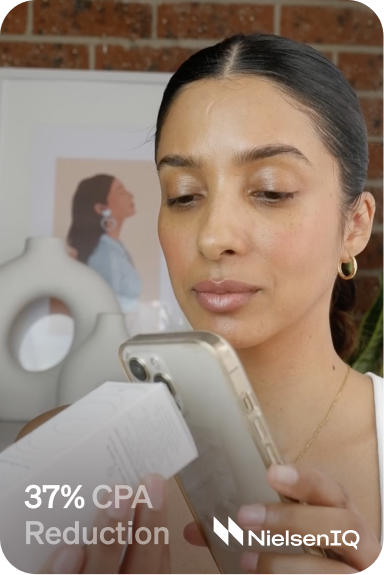
.svg)
.svg)
.svg)
.svg)

.svg)


In 2025, Meta Platforms continues to influence how you reach, engage, and convert audiences across Facebook, Instagram, and WhatsApp. The size of its user base alone shapes where budgets go and how competitive the ad space becomes. That’s why knowing the right numbers (like who’s active daily, which formats drive conversions, and how ad spend trends are shifting) can help you guide smarter, faster decisions.
In this article, you’ll see the latest performance metrics, compare audience behaviors, and identify where your campaigns can deliver the highest ROI. Let’s look at the numbers that matter most to your next strategy.
Key Meta Statistics in 2025
Understanding the most relevant metrics helps you decide where to focus ad spend and which formats will drive the best returns. These figures provide a snapshot of Meta’s scale, engagement, and advertising potential.
Here are the key statistics you need to know:
1. As of August 8, 2025, Meta Platforms holds a market capitalization of approximately $1.93 trillion.
2. Meta Family of Apps averaged 3.43 billion daily active users in March 2025, up 6% year over year.
3. Meta Platforms’ latest financial reports show a trailing twelve-month revenue of $178.8 billion.
4. In 2024, Meta earned more than $160 billion from advertising, which makes up the bulk of its total revenue.
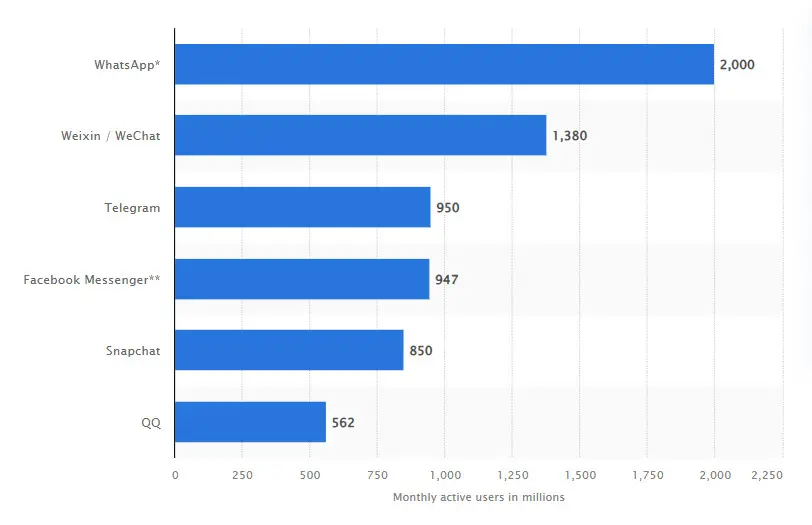
5. According to a Statista report, Facebook was the first to exceed 1 billion registered accounts and now has over 3 billion monthly active users.
6. The same Statista report also notes that Instagram and WhatsApp each stand at 2 billion monthly users.
7. Threads grew to 320 million monthly users by January 2025.
8. Meta’s Reality Labs ships 73% of all VR headsets worldwide.
9. According to Macrotrends, Meta Platforms spent $48.45 billion on research and development in the twelve months ending June 30, 2025, marking a 20.3% year-over-year increase.
10. Instagram’s @Creators on Threads reported that Reels make up 50% of all time spent on Instagram, and users share 3.5 billion Reels daily across Facebook and Instagram.
Meta Usage and Acquisition Statistics in 2025
To plan budgets and judge channel mix, you need context instead of just raw counts. These are the usage and acquisition signals that explain reach ceilings, competitive pressure, and where you can gain an edge.
Here are the stats you’ll build on next.
11. Each month, 73.7% of active internet users worldwide use a Meta-owned service.
When reach is nearly universal, you plan for saturation rather than gaps. That shifts the advantage to message quality, pacing, and distinct positioning in crowded feeds across social media platforms. So test lift with geo holdouts or Brand Lift and fund segments that sustain it.
12. Cropink found out that 60.56% of internet users visit a Meta app daily, and 40.85% of the global population does the same.
Daily habits make attention cyclical, and timing matters. That favors steady storytelling with frequent creative refresh so you stay present with daily active people without causing fatigue. So track assisted conversions week over week and back narratives that compound along with same-day clicks.
13. According to NapoleonCat, as of July 2025, the U.S. has about 279.8 million Facebook users, 172.6 million Instagram users, and 194.8 million Messenger users.
With that kind of national-scale presence across Facebook, Instagram, and Messenger, you can choreograph cross-app journeys that feel seamless. Overlaps here aren’t a problem because they’re a feature.
Start with short-form video for prospecting, deepen intent through messaging, and close with high-intent placements. Calibrating ad targeting around cohorts instead of channels allows you to have a better shot at lifting blended ROAS.
14. Meta has completed 96 acquisitions in total, highlighting the scale of its buying activity.
That kind of deal history signals a platform that’s always evolving. You can expect changes that fold commerce, messaging, and Meta AI deeper into campaigns. To keep pace, it’s worth building flexible data pipelines (pixel plus Conversions API) and maintaining dual-source reporting so your strategy holds steady through product or policy shifts.
15. According to the 2025 Global Digital Report by Meltwater, 77.9% of Facebook users also use Instagram, and 73.6% use WhatsApp. 80.3% of Instagram users use Facebook, 77.1% use WhatsApp, and 77.9% of WhatsApp users use Facebook, and 79.2% use Instagram.
High cross-platform usage means your campaigns can usually reach the same person multiple times across different apps. This overlap can strengthen brand recall when messaging is consistent, but it can also lead to wasted impressions if frequency isn’t managed. To maximize efficiency, segment by behavior instead of only platform and track user engagement across the full journey.
16. Statista reports that Facebook’s largest U.S. user group is aged 25-34. This makes up 12.2% of both male and female users.
This age range represents prime spending power and is typically a core target for e-commerce and social commerce campaigns. Knowing that both men and women in this group are equally represented allows you to build a creative that appeals broadly without heavy gender bias. Position offers and calls-to-action to match their life stage (think career advancement, lifestyle upgrades, and major purchases).
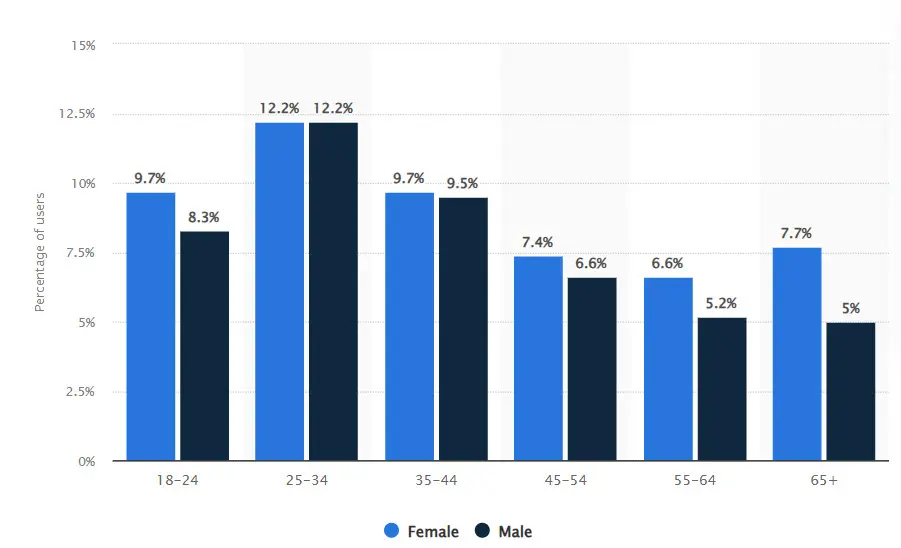
17. The above Statista report also shows that women slightly outnumber men in most age brackets, with the biggest gap in the 65+ group (7.7% female vs. 5% male).
Gender distribution can influence everything from imagery to offer framing. The largest gap in the 65+ segment signals opportunities for brands catering to female-led purchase decisions in older demographics. Use this insight to refine Facebook demographics targeting and consider content that resonates with both practical needs and aspirational messaging for these age groups.
18. Another report from Statista shows that four Meta platforms rank in the global top ten for monthly users.
This dominance in the social media industry gives you unmatched reach potential, but it also means your competitors are there too. Standing out requires more than just presence. It’s about creative differentiation, smart placement choices, and data-backed optimization. Treat these platforms as the backbone of your paid and organic strategy, while testing emerging channels for diversification.
Meta Marketing & Advertising Statistics
Meta’s advertising footprint shows how deeply embedded it is in global marketing strategies. The data below shows adoption rates, audience reach, and creative tools that influence your media mix.
Here are the numbers worth factoring into your next move.
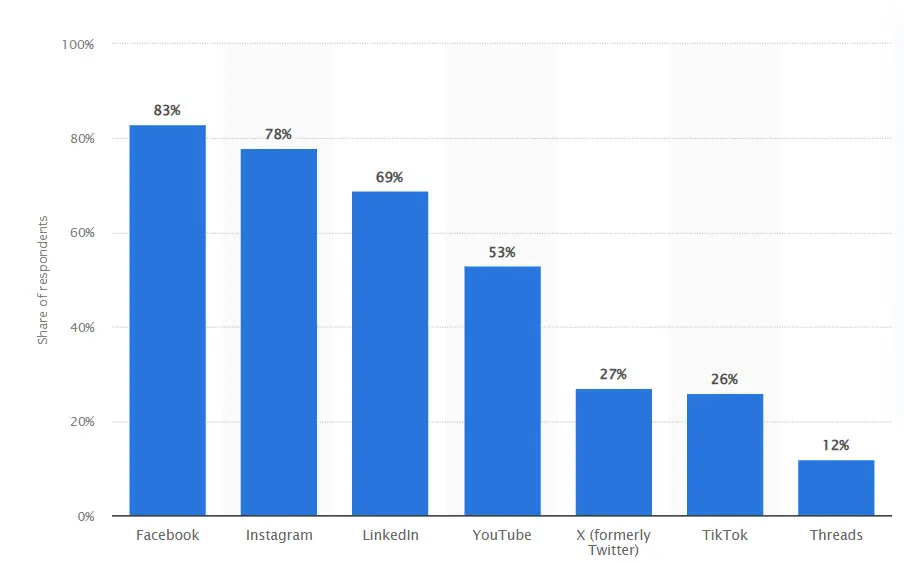
19. According to Statista, 83% of marketers worldwide use Facebook, 78% use Instagram, and 12% use Threads as part of their social media strategies.
High adoption means you’re competing in crowded ad auctions across each social platform. The advantage comes from creative differentiation and smarter bid strategies rather than channel choice. Use audience insights to find micro-segments where competition is less intense and your CPMs hold steady.
20. HubSpot reports that 40% of marketers rank Facebook among their top three social media platforms for driving ROI.
This level of confidence reflects proven performance in both direct response and brand lift. It also suggests that even mature advertisers see room for incremental gains. You can use this as leverage when defending your Facebook marketing strategy budgets to stakeholders.
21. According to Investing.com, Facebook ads reach 34.1% of the global population aged 13+, or about 2.11 billion people.
Such reach makes Facebook an anchor for large-scale prospecting campaigns. However, wide coverage also demands more precise creative testing to avoid wasted impressions. Therefore, align your ad engine settings to optimize for actions that matter most to your funnel.
22. At the start of 2025, Facebook’s ad reach in the United States equaled 56.8% of the total population.
This penetration supports national campaigns without heavy reliance on third-party publishers. It also means saturation risk is higher in certain verticals. Refresh content formats frequently to maintain attention and reduce creative fatigue in high-frequency audiences.
23. A typical user clicks 12 Facebook ads each month.
Frequent ad interaction indicates that users are receptive to commercial content when relevance is high. The opportunity lies in serving the right offer at the right point in the journey. Retargeting based on prior engagement can turn these clicks into measurable revenue.
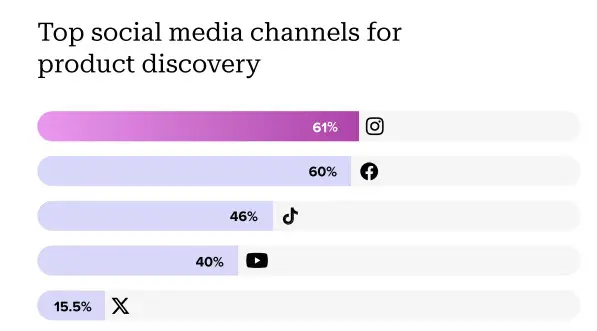
24. According to Sprout Social’s Social Media Content Strategy Report, 61% of social media users use Instagram to find their next purchase, which makes it the leading platform for product discovery.
This product discovery role makes Instagram a top-of-funnel powerhouse for digital advertisers. Hence, you can pair aspirational creative with clear paths to purchase to shorten decision cycles. Leverage high-intent audiences from product views for retargeting in Meta Ads Manager.
Pro tip: Influencer partnerships can outperform ads when done right. Our paid ads vs. influencer marketing article helps you decide where your budget will go furthest.
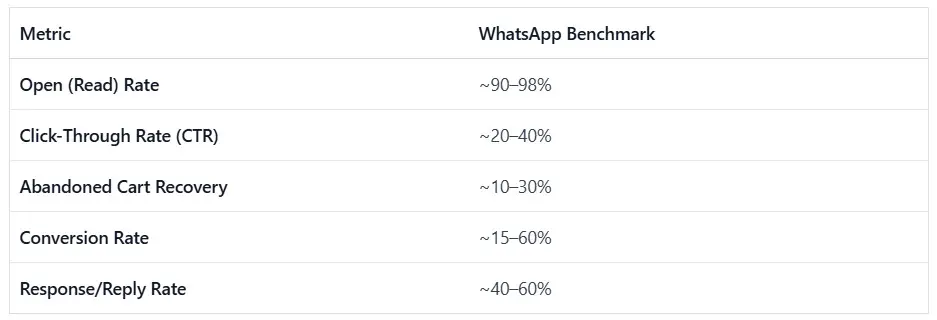
25. Wapikit reports that WhatsApp messages show a 98% open rate and drive purchases for 66% of users who chat with a business.
Exceptional open rates position WhatsApp as a direct-response communication channel. Integrating chatbots or live reps into these conversations can accelerate conversion. You can track chat-driven sales separately to understand their incremental impact on your pipeline.
Pro tip: Data-driven targeting is powerful but only if you know how to use it. Our marketing measurement guide covers KPIs, methods, and tools to help you track what matters most in your campaigns.
26. MarketBeat notes that by Q4 2024, Advantage+ Shopping campaigns generated over $20 billion in annual run-rate revenue. This reflects a 70% increase from the previous year.
Such rapid ad revenue growth highlights automation’s role in scaling e-commerce performance. It might be better to let Advantage+ handle the heavy lifting for audience discovery, while you focus on refining creative hooks that feed the algorithm better data.
27. Marketing Dive reports that over 4 million Meta advertisers now use at least one of its generative AI tools, spanning image, video, and text creation.
Mass adoption of AI-assisted creative changes the baseline for quality and speed. This means your output must be both fast and strategically distinct. Combine AI models with strong brand voice guidelines to prevent creative homogenization.
Meta Financial Highlights That Could Affect Businesses
Meta’s financial performance offers a direct view into where the company is prioritizing growth and how those moves can affect your marketing landscape. These figures reveal shifts in revenue streams, cost structures, and strategic bets.
28. In Q1 2025, Meta reported revenue of $42.31 billion, up 16% year over year.
Strong top-line growth signals sustained advertiser confidence despite rising competition. This kind of increase usually reflects both higher ad demand and improved monetization per user. For you, it reinforces the platform’s ability to deliver scale in paid campaigns.
Pro tip: If you want to see how ad spend is being optimized across industries, our list of the top 31 media buying agencies breaks down who’s delivering the best ROI right now.
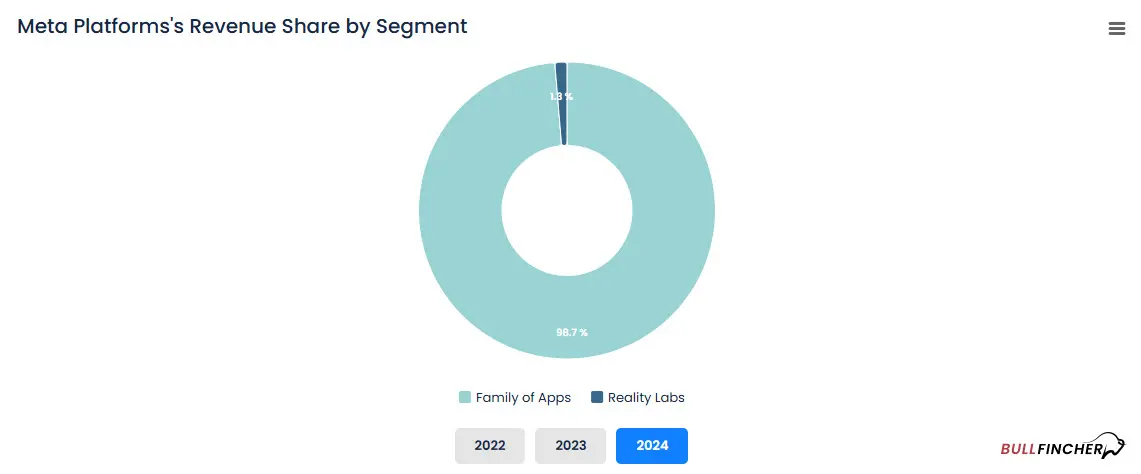
29. Bullfincher.io reports that in fiscal year 2024, Meta’s Family of Apps segment generated $162.36 billion, accounting for 98.7% of total revenue.
Such concentration shows that the core social network products remain Meta’s primary revenue driver. This stability gives the company more flexibility to invest in ad tools and targeting capabilities. As a marketer, you benefit from these improvements without relying on emerging products.
30. In its Q1 2025 press release, Meta stated that it expects full-year 2025 capital expenditures to range between $64 billion and $72 billion, up from the earlier projection of $60-65 billion.
A jump in capital spending usually points to infrastructure and technology upgrades, such as AI-optimized data center capacity. These investments can improve delivery speed and targeting precision. Over time, that could raise both your campaign efficiency and competitive pressure.
31. As of March 31, 2025, Meta’s headcount stood at 76,834, an 11% increase over the previous year.
Expanding staff suggests a renewed focus on product development, ad tech, and support. More talent in these areas can lead to faster feature rollouts and better advertiser tools. This growth can also improve your ability to execute cross-platform strategies.
32. In Q4 2024, Meta Reality Labs recorded its highest quarterly revenue to date of $1.083 billion, driven by the launch of the Quest 3S.
Strong hardware sales in virtual reality open new surfaces for branded content and immersive ad formats. Early adoption here could position you ahead of competitors. As consumer adoption expands, these environments may evolve into high-engagement ad channels.
33. Business Insider reports that Reality Labs has accumulated more than $60 billion in losses since 2020.
Sustained losses indicate the long-term nature of Meta’s immersive tech strategy. While it’s a risk for the company, it signals a commitment to the mixed reality space. As an advertiser, you can monitor adoption milestones to time your entry for maximum impact.
34. Meta is projected to account for over 23% of global digital ad spend in 2025.
Owning nearly a quarter of worldwide digital marketing budgets shows its dominance in the paid media mix. This concentration means shifts in Meta’s ad policies or algorithms can have outsized effects on your performance. Diversification remains key while leveraging its unmatched scale.
Facebook Key Insights for Marketers in 2025
Facebook is still one of the biggest drivers of attention online, and that scale shapes how you plan and run campaigns. The numbers below show where people spend time, what they do, and how you can use that behavior to your advantage.
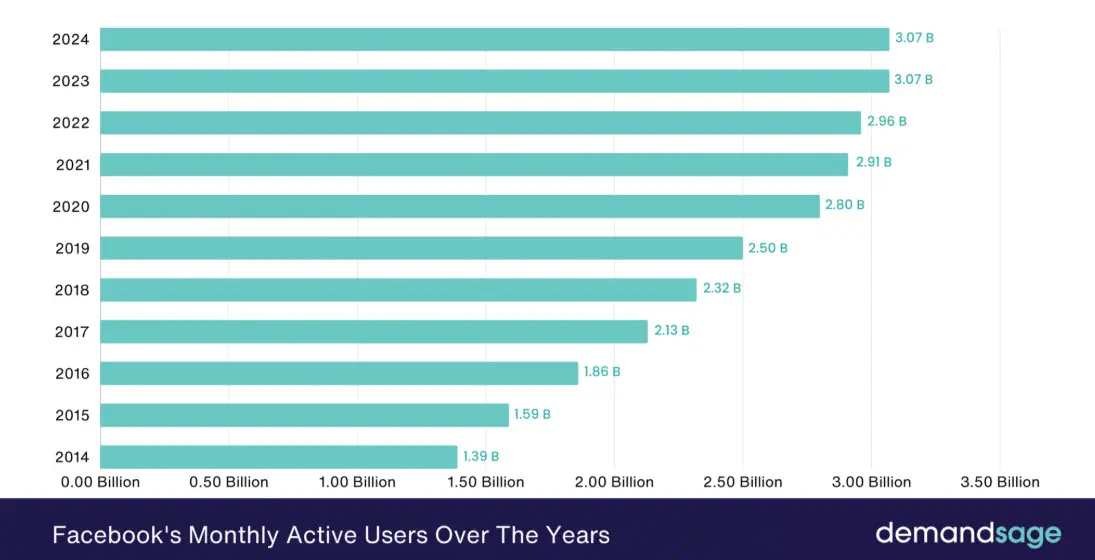
35. According to DemandSage, Facebook has 3.07 billion monthly active users, with 2.11 billion logging in daily, which is about 68.7% of its monthly user base.
A daily audience this large gives you a steady base to work with. That kind of consistency makes it easier to test ideas and see quick results. It also means you can build long-term audiences without worrying they’ll disappear overnight.
36. Business Insider reports that each month, as many as 1.228 billion online shoppers worldwide buy from Facebook Marketplace, and 51.2% of social media users say their most recent social purchase came from it.
Marketplace is an amazing shopping engine. When buyers are already in purchase mode, the gap between seeing an item and buying it gets much smaller. That’s why pairing ads with Marketplace listings can push sales faster.
37. eMarketer states that in 2025, U.S. adults were 38.5% likely to make purchases directly on Facebook.
This shows that Facebook can close sales on its own. When the whole buying process happens in one place, you cut the risk of losing people mid-journey. That’s a big plus for campaigns aimed at quick conversions.
38. In the first half of 2025, Meta took action against approximately 500,000 accounts engaged in spammy behavior or fake engagement.
Cleaning up fake activity makes real engagement data more reliable. That’s important when you’re deciding which audiences or creatives are working. Better data means you can fine-tune campaigns with more confidence.
39. MixBloom reports that people spend an average of 30.8 minutes per day on Facebook, with just 1.7% accessing it via desktop and the vast majority using mobile devices.
Since almost everyone is on mobile, vertical creative and quick-loading pages aren’t optional. Mobile-friendly ads keep people from bouncing, especially in areas with slower internet. Even small delays can mean lost clicks.
40. Groups see participation from 1.8 billion people each month.
Groups give you ready-made communities where people share common interests. That makes targeting easier and messages more relevant. If you tap into the right groups, you can connect with audiences who are already engaged in your niche.
41. According to GiraffeSocial, 56% of Facebook’s global audience is male and 44% is female, with women more active in groups, events, and content sharing.
Knowing who’s more active in certain spaces helps you choose the right format. For example, share-heavy campaigns may work better where women are more engaged. Matching creative to these patterns can stretch your ad spend further.
42. GiraffeSocial also reports that Facebook’s global audience is 19% aged 18-24, 31% aged 25-34, 16% aged 35-44, 10% aged 45-54, and 24% aged 55+.
These age splits tell you where the bulk of your reach will come from. Younger users may respond to faster, trend-driven creative, while older groups might prefer clear, detailed messaging. Adjusting tone and format by age can lift results.
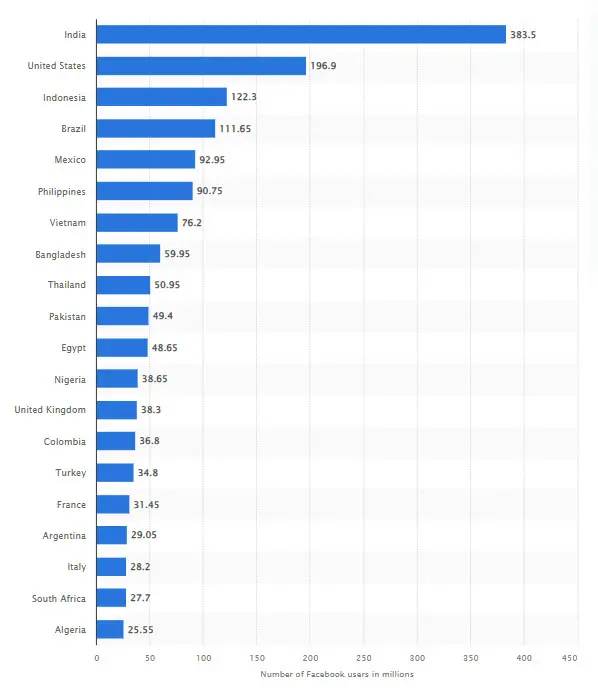
43. In India, Facebook reaches 383.5 million people, the platform’s largest country audience.
If India is part of your market, that kind of scale can be a huge growth driver. But more competition also means you’ll need sharper targeting. Segmenting by language, region, and interests keeps your message relevant.
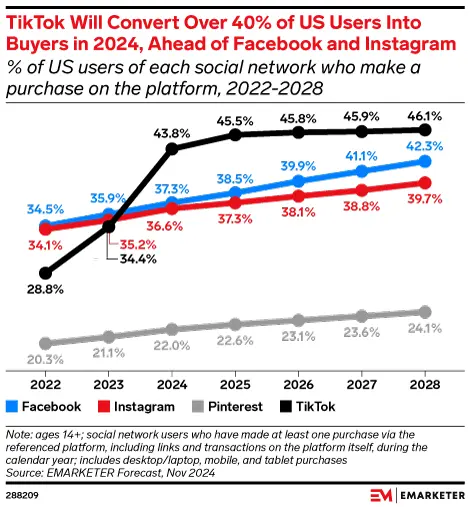
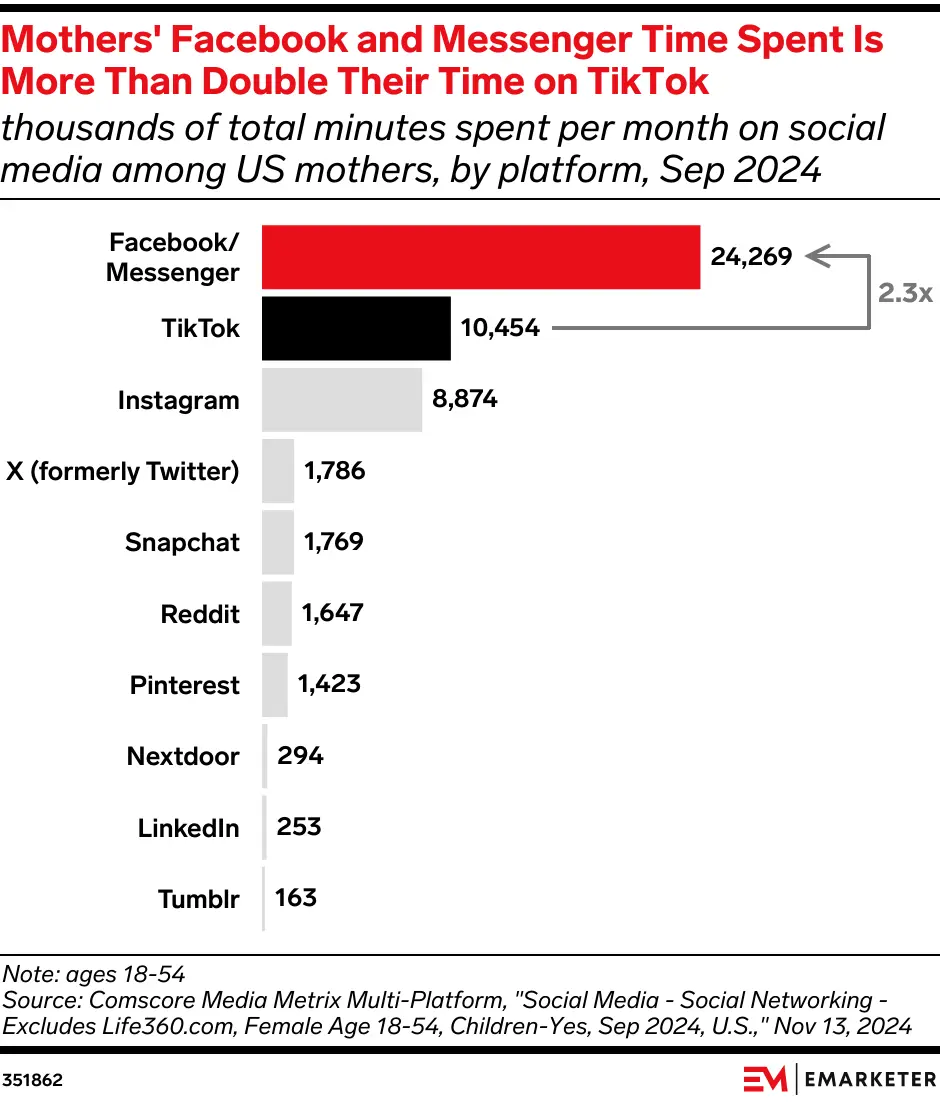
44. U.S. mothers spend 2.3× more time on Facebook than on TikTok.
More time spent means more chances to get in front of them with your brand. This is especially valuable if you sell parenting, household, or lifestyle products. Keeping a steady flow of content can turn that attention into sales.
Instagram Trends That Matter in 2025
Instagram keeps growing as a go-to channel for brands that want to reach engaged, purchase-ready audiences. The stats below show how people use it, how they interact with brands, and where you can focus to get better results.
45. According to Exploding Topics, Instagram users spend an average of 12 minutes and 10 seconds per visit, view about 9.82 pages, and have a 50.34% bounce rate.
The time spent per visit gives you a decent window to grab attention. With nearly 10 page views, users are exploring beyond just their feed. This makes it easier to pull them into more content before they leave.
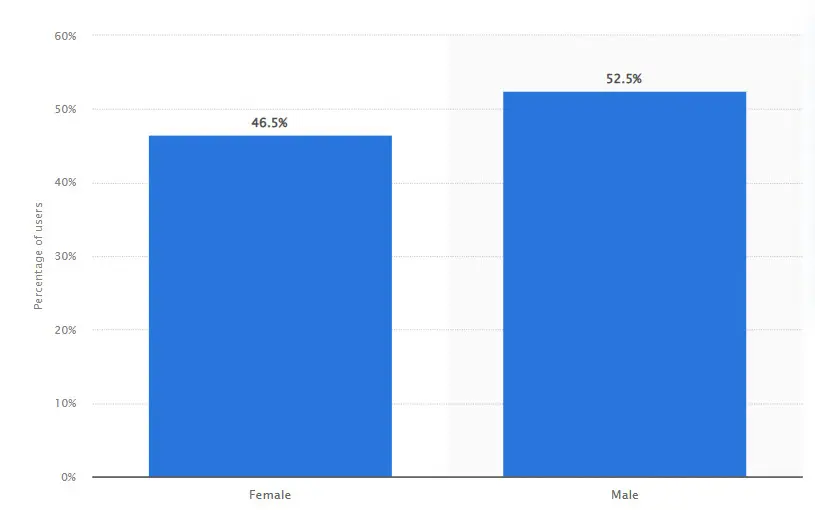
46. Statista shows that the global distribution of Instagram users is 46.5% female and 52.5% male.
A fairly balanced split means your targeting can be wide without major gender adjustments. Still, knowing your own audience mix lets you fine-tune creative. The closer the match, the better your engagement rates.
47. The Social Media Content Strategy Report from Sprout Social notes that 50% of users engage with brands on the platform at least once a day.
Daily brand interactions give you frequent touchpoints to build familiarity. When people see you consistently, they’re more likely to think of you when it’s time to buy. That’s why a steady posting schedule pays off here.
Pro tip: Instagram still dominates brand attention. For campaign inspiration, see our roundup of the top 30 Instagram advertising agencies turning engagement into measurable sales.
48. The same report also notes that 69% of social media users say Instagram delivers the most engaging brand content, and 44% want brands to post there more often.
High demand for content means you have room to post without oversaturating. If your posts keep people engaged, you can safely increase output. More activity can also increase visibility in the feed.
49. According to Zebracat, 71% of Gen Z users follow at least one brand account on Instagram.
This makes the platform especially strong for younger audiences. Gen Z tends to expect a two-way connection. And responding to comments or using other Instagram features, like Stories polls, can strengthen that link.
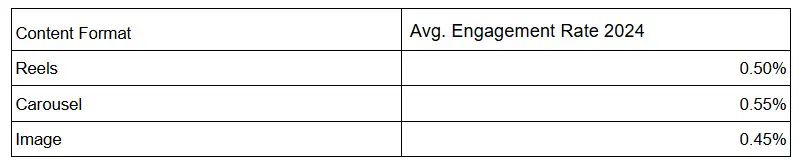
50. SocialInsider’s 2025 benchmarks show Instagram Reels have an average engagement of 0.50%, slightly below carousels.
While Reels are popular, this shows carousels can still outperform in certain cases. Testing both formats side by side helps you spot what your audience prefers. The results may shift depending on your niche.
51. Meta’s updated Reels Ads Guide notes that 79% of users report buying a product or service after watching a Reel.
Reels can drive direct sales along with awareness. Showing your product in action builds trust quickly. Pairing strong visuals with a clear call-to-action can make that impulse to buy even stronger.
Pro tip: Short-form content is where the scroll stops. Our top 31 short-form video agencies review shares experts that can help you hook your viewer's attention in under 15 seconds.
WhatsApp by the Numbers: Messaging Power in 2025
WhatsApp has evolved from a personal chat app into a key business tool for direct sales, customer service, and brand loyalty. The stats below show just how deep its reach goes, how quickly people respond, and where the platform can help you connect.
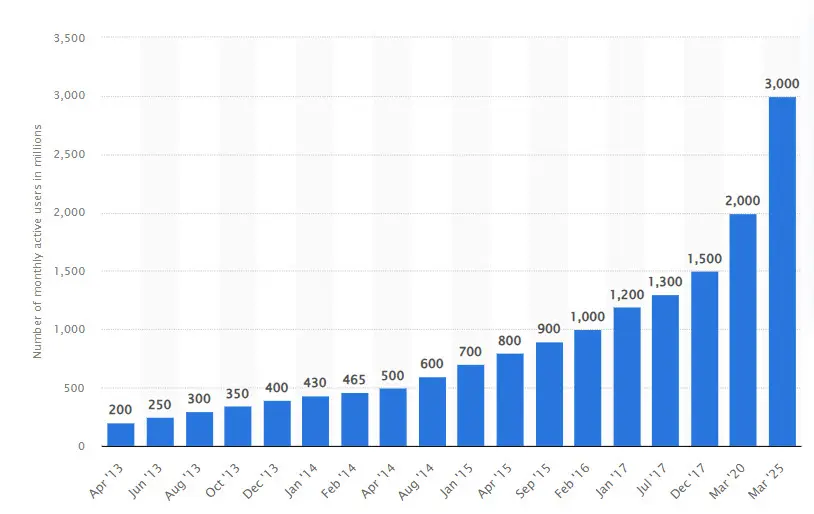
52. As of March 2025, WhatsApp reached 3 billion monthly active users, up from just over 2 billion in March 2020.
That’s a billion extra people in just five years, which means the audience is still expanding. Growth at this scale keeps ad and commerce opportunities fresh. It also gives you more potential markets to test without leaving the platform.
53. WhatsApp ranks as the leading messaging app in 26 countries.
Owning the top spot in so many markets gives you a strong entry point for international campaigns. This is especially useful when launching products in regions where other Meta platforms have lower reach. You can go straight to the channel people already use most.
54. WhatsApp reached 100 million monthly active users in the United States.
The U.S. user base may be smaller than in other regions, but it’s growing fast. That makes now a good time to build brand presence before the space becomes crowded. Early movers usually enjoy lower costs and better engagement.
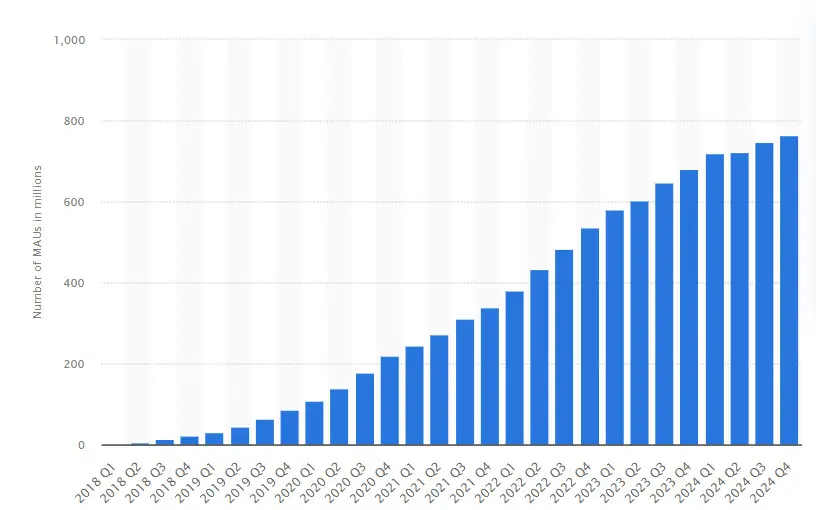
55. In Q4 2024, WhatsApp Business recorded over 764.38 million monthly active users.
This shows the demand for business messaging is massive. More companies are using it for sales, support, and updates, so competition is rising. That’s why quick response times and clear messaging matter more than ever.
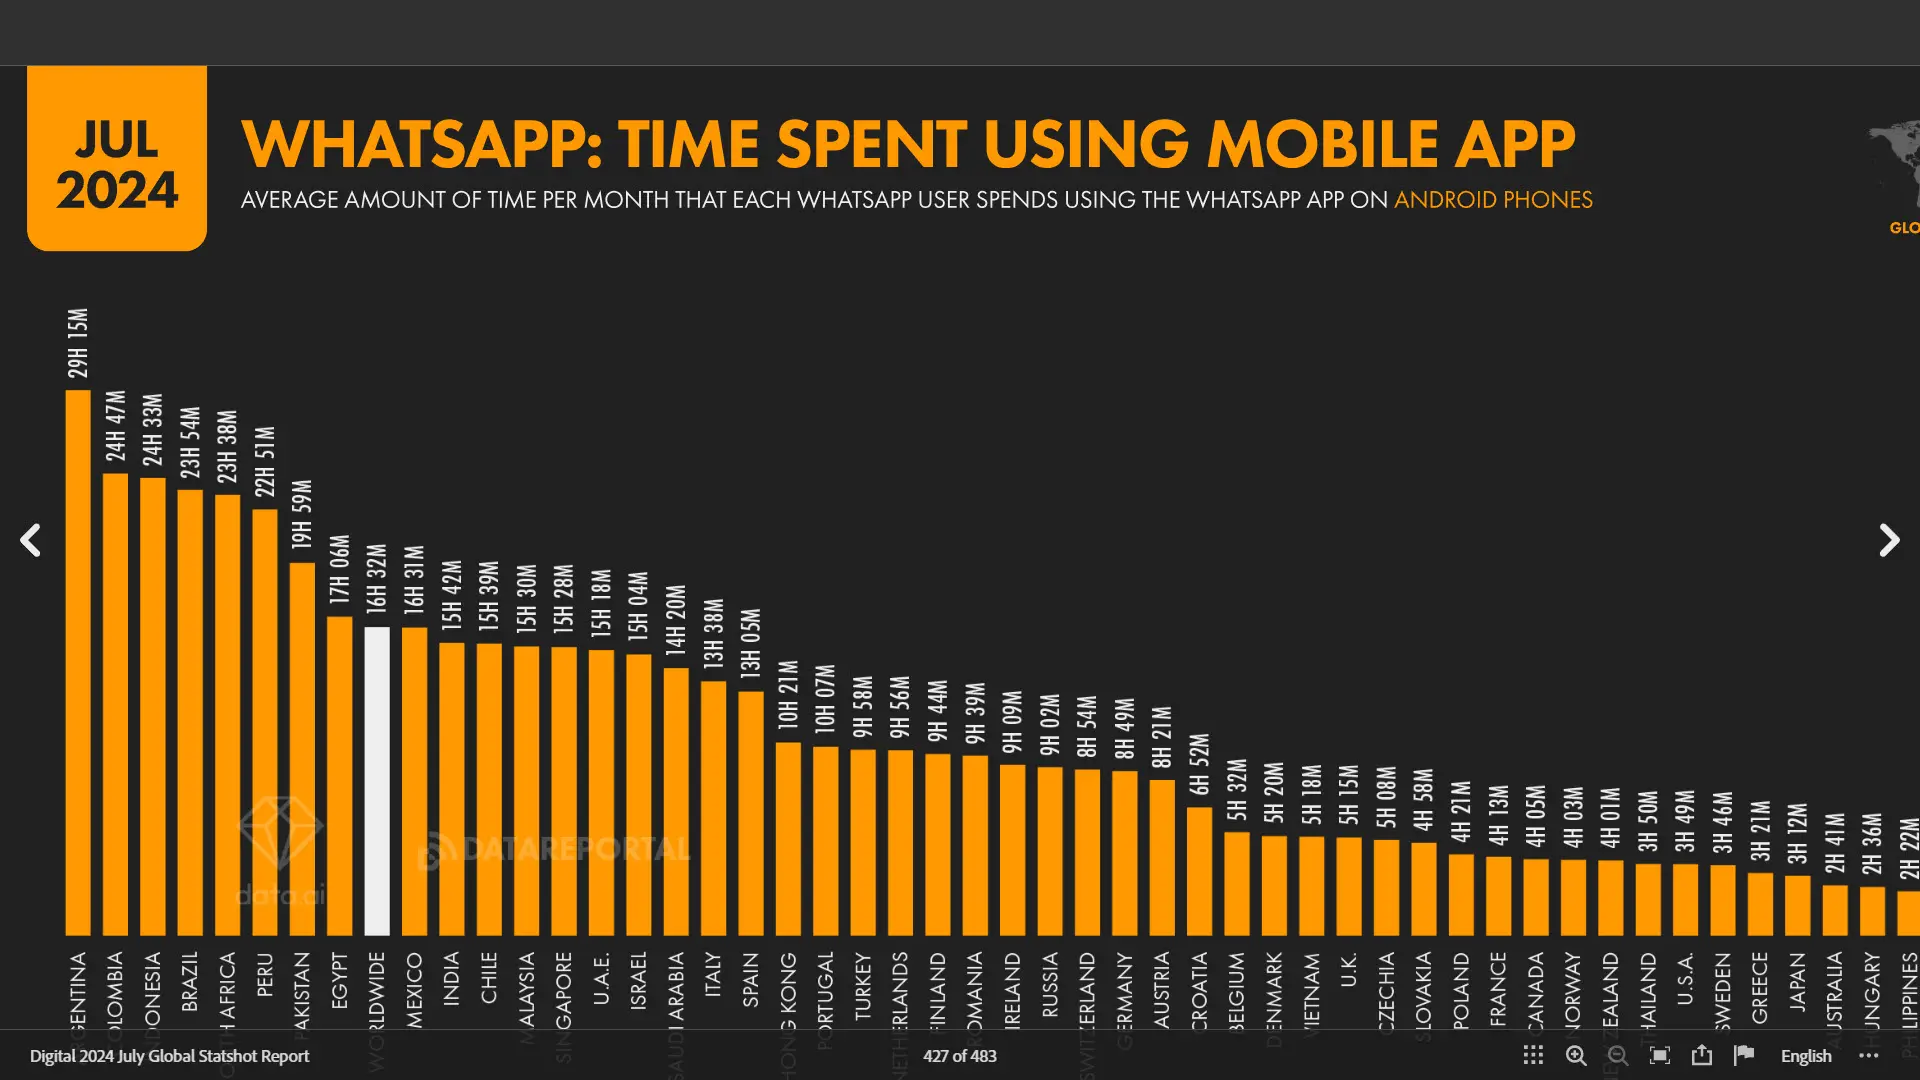
56. According to Meltwater’s 2024 Global Digital Report, people worldwide spend an average of 16 hours and 32 minutes per month using the WhatsApp mobile app.
That much time means plenty of chances to connect. The more frequently people open the app, the more likely they are to see your messages. Consistent but non-intrusive communication keeps your brand in their routine.
57. Zixflow reports that using WhatsApp catalogs keeps 83% of buyers engaged with brands, and 75% make an immediate purchase as a result.
Catalogs work because they make shopping instant and visual. When people can browse without leaving the app, buying feels easier. This is especially valuable for impulse-driven products or seasonal offers.
58. According to WhatsApp, 80% of messages are read within five minutes of being received.
Almost instant reads mean you can time messages for maximum impact. That’s perfect for flash sales, restock alerts, or urgent updates. Quick visibility also helps improve conversion rates for time-sensitive offers.
59. Wapikit reports that WhatsApp campaigns can recover 10-30% of abandoned shopping carts.
Direct messaging puts you right back in front of someone who almost bought. A short reminder or an extra incentive can bring them back to complete the purchase. This makes WhatsApp a strong recovery tool for e-commerce.
60. According to The Coders Blog, WhatsApp users send over 100 billion messages and spend more than 2 billion minutes on voice and video calls each day.
High daily activity means your messages don’t sit unnoticed. Calls add another layer of connection, especially for high-value sales or customer service. Combining both can strengthen relationships and improve loyalty.
Facebook Messenger: Reach, Engagement, and Advertising Potential
Messenger remains one of Meta’s strongest tools for direct, one-on-one communication at scale. The stats below show how people use it, how businesses connect with them, and what kind of advertising reach you can expect.
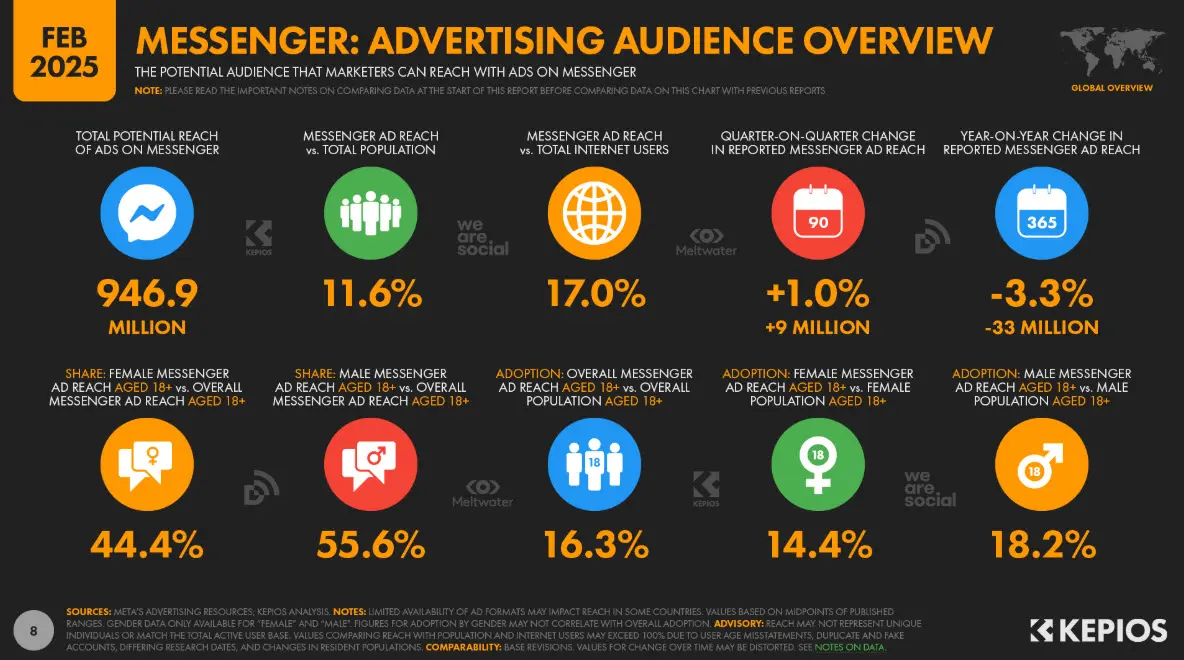
61. As of February 2025, Facebook Messenger had approximately 947 million monthly active users worldwide.
That’s a massive audience for a messaging platform because it gives you room to run campaigns with both scale and personalization. This mix makes it effective for customer service, sales follow-ups, and targeted promotions. The reach alone can justify adding Messenger to your strategy.
62. More than 20 billion conversations take place between businesses and users monthly at Facebook Messenger.
High conversation volume shows that people are already using Messenger to interact with brands. This makes it easier to meet customers where they’re comfortable. It also means faster responses can set you apart from competitors.
Pro tip: The above stats show that Messenger is more than a social chat tool. Our 60+ lead generation statistics show how direct messaging can influence customer decisions.
63. Smarter Digital Marketing reports that business-oriented messages on Facebook Messenger can reach open rates as high as 88% and click-through rates up to 56%.
These performance numbers are far above most email averages. The instant and direct nature of messaging explains the difference. It’s a reminder that Messenger can be a high-ROI channel when used with relevant, timely offers.
64. According to a Messenger report from DataReportal, the potential audience for Messenger ads dropped by 32.5 million users, a decline of 3.3% between January 2024 and January 2025.
A decline in ad reach can signal stronger competition for available impressions. If demand stays high, this could lead to higher costs. Keeping a close eye on CPM trends will help you budget effectively.
65. DataReportal report shows that in January 2025, Messenger ads reached 11.6% of the global population they also reached 16.3% of the global adult population aged 18 and over.
This shows Messenger ads can still touch a meaningful share of people worldwide. Adult reach makes it suitable for products and services with a clear buying demographic. Placement testing can help identify where Messenger ads perform best in your funnel.
66. Based on the same DataReportal report, Messenger’s largest user bases were in India (109M), followed by the Philippines (61.8M), Mexico (57M), Vietnam (55.9M), and Brazil (51.3M).
Knowing where the biggest audiences are can guide your market expansion plans. Localizing creative and offers for these regions can boost performance. It also helps you prioritize translation and cultural adaptation efforts.
67. The report also shows that Meta’s planning tools showed Messenger’s audience to be 44.4% female and 55.6% male.
Understanding user demographics helps refine message tone and product positioning. Even small differences in engagement habits can shift campaign results. Testing creative variations by gender can highlight where to put more budget.
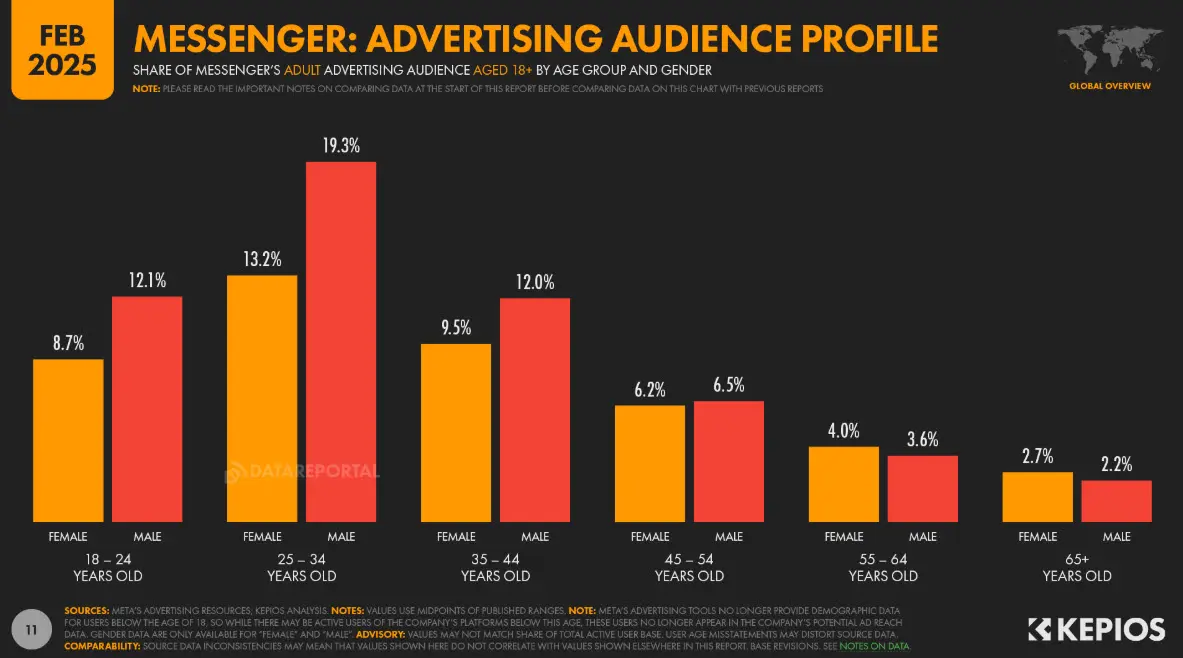
68. DataReportal’s analysis of Meta’s planning tools shows that in January 2025, Messenger users were mostly aged 25-34, with men in this age group making up the largest share.
This age group usually has strong buying power and is active online daily. Targeting them with high-intent offers can lead to quicker sales. Keeping messaging relevant to their lifestyle and needs will improve click and conversion rates.
Threads in 2025: Growth, Engagement, and New Opportunities
Threads has quickly shifted from a niche launch to a major player in Meta’s lineup. The numbers below show how its audience is growing, how people use it, and what that means for your campaigns.
69. During Meta’s Q1 2025 earnings call, CEO Mark Zuckerberg announced that Instagram Threads had surpassed 350 million monthly active users, up 30 million from the previous quarter’s 320 million.
Fast growth quarter over quarter shows Threads is still pulling in new audiences at scale. That kind of momentum keeps ad inventory expanding and lowers early CPMs. Acting now could lock in better performance before competition rises.
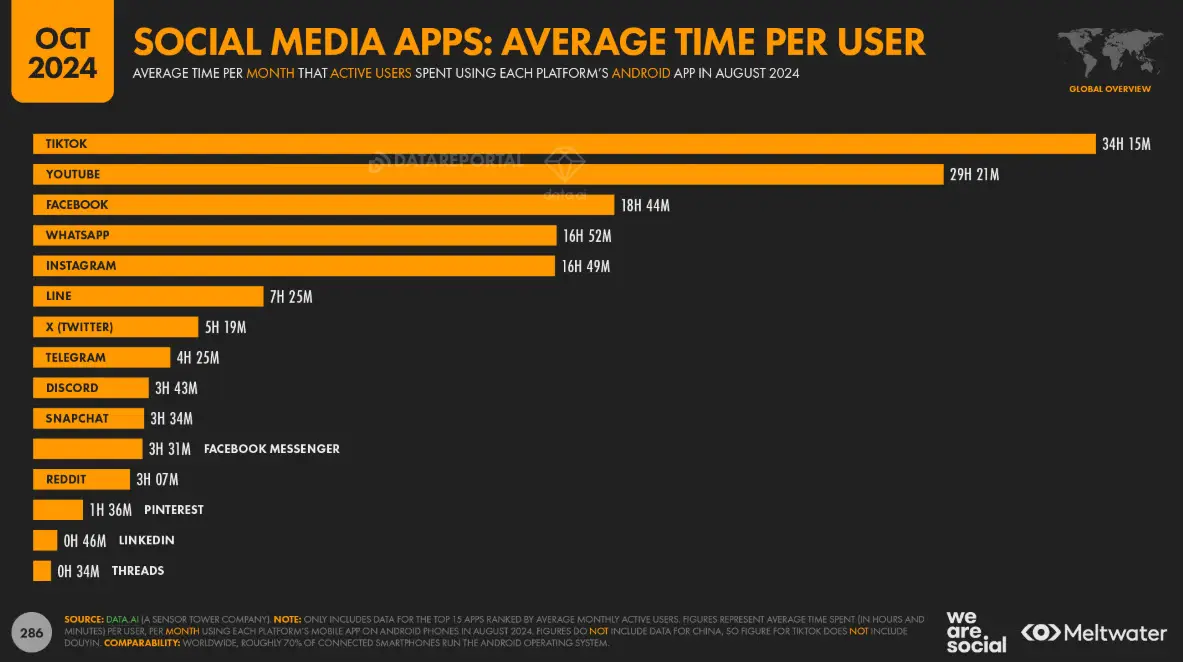
70. On average, Threads Android app users spend 34 minutes per month on the platform.
While the total time is lower than Instagram or Facebook, it’s enough to deliver brand exposure without overwhelming users. This lighter activity suggests focusing on high-impact content that stands out quickly. Short, scroll-stopping creatives work best here.
71. Business of Apps estimates that Threads could add up to $11.3 billion to Meta’s revenue by 2026.
That potential makes Threads a priority for Meta, which means more features and ad tools are likely on the way. As the platform matures, early adopters can benefit from lower costs and more flexible targeting options.
72. TechCrunch reports that in June 2025, Threads had 115.1 million daily active users on iOS and Android, up 127.8% year over year.
A daily audience growing this quickly signals high retention and rising relevance. More frequent visits give you better chances to re-engage people who’ve interacted with your brand. This is the kind of activity that supports full-funnel campaigns.
73. According to Reuters, Threads has begun rolling out its direct messaging feature worldwide, starting with regions such as Hong Kong, Thailand, and Argentina.
Direct messaging opens a new channel for personalized outreach. It lets you nurture leads and support customers without leaving the platform. As availability expands, integrating messaging into your campaign flow will become more valuable.
74. Reuters also reported that U.S. monthly active users are projected to reach 60.5 million by 2026, surpassing X’s declining user base, which is expected to drop to about 50 million.
This shift could make Threads a leading space for real-time conversation in the U.S. If your brand relies on timely content or trending topics, planning for a larger presence here could pay off.
75. Threads has now opened advertising globally as of April 2025.
Global ad access gives you the ability to test campaigns in multiple regions at once. Early campaigns can help you identify which markets deliver the strongest ROI. With lower competition at launch, you may see better results for less spend.
Meta AI and the Metaverse: Growth, Adoption, and Commercial Potential
Meta is investing heavily in AI and immersive technology, betting that these areas will drive the next wave of engagement and revenue. The stats below show how fast these tools and platforms are growing, where users are spending their time, and how businesses can benefit.
76. Campus Technology reports that Meta AI’s monthly active users rose from 600 million in December to 700 million in January.
That’s a rapid jump in just one month, which shows strong adoption. Growth at this pace suggests AI tools are quickly becoming part of everyday workflows. The earlier you integrate them, the more likely you’ll stay ahead of competitors.
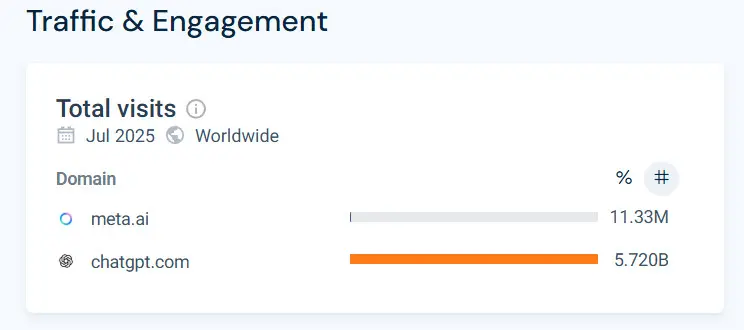
77. According to Similarweb, meta.ai had 11.33 million visits worldwide in July 2025, compared to chatgpt.com, which received 5.72 billion visits.
This gap shows Meta AI is still early in building market share. That can be an advantage for advertisers testing integrations before the platform becomes saturated. Lower competition now can mean better placement and reach.
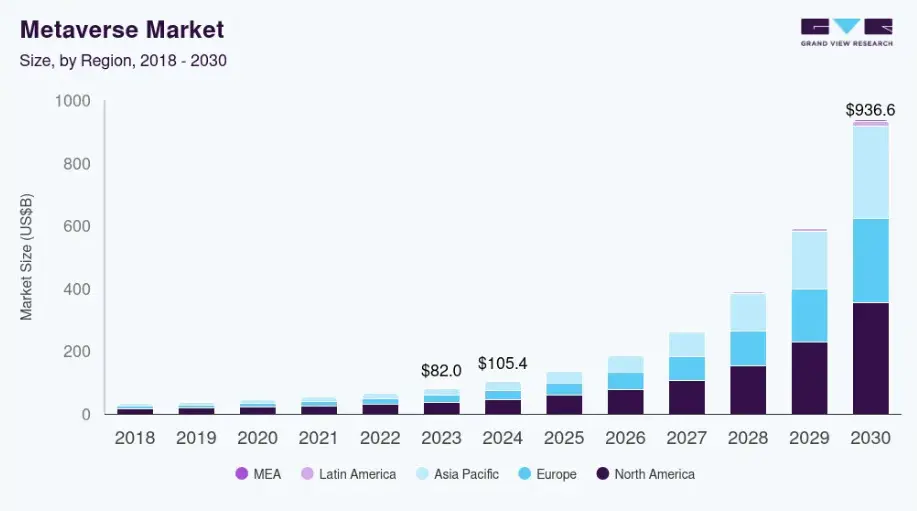
78. Grid View Research estimates the global metaverse market at $105.4 billion in 2024, with projections to reach $936.57 billion by 2030, reflecting a 46.4% CAGR between 2025 and 2030.
Such high growth potential means new revenue streams for brands willing to experiment. Entering early lets you shape your presence before the market matures. Even small test projects can prepare you for a larger push later.
79. There are about 700 million people worldwide who use the metaverse each month.
A monthly audience of this size shows the metaverse is no longer niche. With that many active users, you can start finding communities that match your brand’s audience. Building relationships now can pay off as adoption grows.
80. By 2030, the metaverse user base is projected to grow to 2.6 billion people.
Reaching that scale would put the metaverse on par with today’s biggest platforms. Preparing campaigns and assets ahead of time means you’ll be ready when the audience expands. This long-term planning can help secure early mover benefits.
81. According to Embryo, 60% of gamers use the metaverse for non-gaming activities, while 52% of internet users join for work, 48% for entertainment, and 32% for socialising or online dating.
These varied use cases open the door for brands outside gaming to join the space. Work, events, and social activities create opportunities for sponsored experiences. The key is matching your content to the activity users are there for.
82. Embryo projects that by 2026, roughly 25% metaverse users will spend at least one hour per day in the virtual space.
High daily time spent gives brands more chances to connect meaningfully. That’s enough engagement to support ongoing campaigns rather than one-off events. Consistency will be critical to staying visible in such an immersive environment.
83. A consumer survey found that 75% expect AR when shopping online, 71% would shop more often if retailers used it, and 40% are willing to pay more for AR-enhanced products.
These expectations mean augmented reality is moving from a novelty to a standard. Retailers who adopt AR early can increase conversion rates and justify premium pricing. It’s a clear signal that investment in AR content has a direct sales impact.
84. According to BrandXR, adding 3D/AR content to product listings can boost conversion rates by up to 94%, with some reports showing as much as a 90% lift compared to non-AR listings.
AR gives buyers a better sense of the product, which reduces hesitation. This level of lift can completely change your ROI on paid campaigns. Combining AR with targeted ads could significantly raise revenue per user.
Meta’s Content Safety and Moderation Trends
How Meta handles harmful content directly affects user trust and brand safety. These figures show changes in enforcement, the types of content appearing on the platforms, and how safe environments vary across Meta products.
85. Meta’s Community Standards Enforcement Report shows a 50% reduction in enforcement errors in the U.S., comparing Q4 2024 to Q1 2025.
Fewer enforcement errors mean moderation is becoming more accurate. That’s important for brands because it reduces the risk of legitimate ads or posts being wrongly flagged. Better accuracy also makes performance data more reliable.
86. Bullying and harassment content increased marginally, from 0.06-0.07% to 0.07-0.08%.
Even small increases can impact community sentiment. This uptick suggests moderation teams may need to focus more on prevention tools. For advertisers, it’s a reminder to keep comment moderation active on campaigns.
87. Graphic or violent content on Facebook rose to about 0.09%.
Rising exposure to graphic content can affect brand perception if ads appear near it. Using placement controls can help reduce that risk. Staying on top of safety settings in Ads Manager is essential.
88. A study by the Centre for Countering Digital Hate (CCDH) estimates Meta's moderation changes could lead to 277 million additional harmful posts per year on Facebook and Instagram.
That’s a large volume of potentially harmful content slipping through. Higher visibility of such content could push more users toward private groups or alternative platforms. For brands, it emphasizes the need to track where ads appear.
89. According to a Global Witness survey, more than 90% of land and environmental defenders encountered online harassment, with 62% of incidents occurring on Facebook in 2025.
This shows that harassment remains a big problem in certain communities. If your campaigns touch on sensitive topics, proactive monitoring is critical. Partnering with trusted NGOs or safety organizations can also help reduce risk.
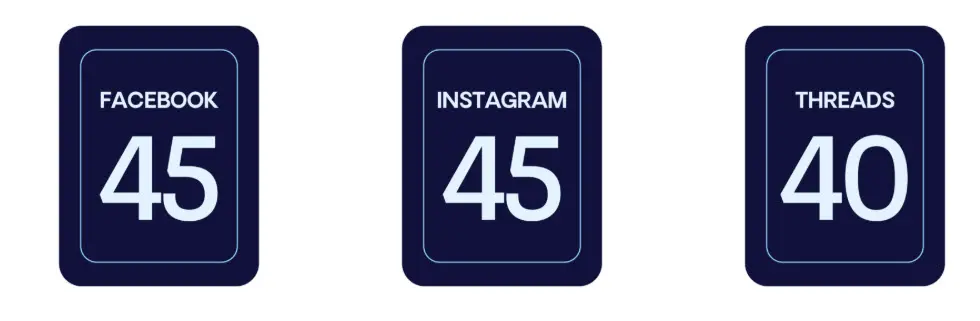
90. GLAAD’s 2025 Social Media Safety Index reported that both Facebook and Instagram scored 45, while Threads scored 40.
Lower safety scores mean there’s room for improvement across Meta’s platforms. For advertisers, this shows the importance of balancing reach with brand safety measures. Knowing each platform’s score can guide where to place the budget.
What All of This Means for Your Performance Creative on Meta
The numbers above tell you how big the playing field is and how expensive it’s getting.
Plus, they make the case for investing in your creative infrastructure. Here’s why:
Performance Creative Optimizes Your Budget
3.43 billion daily active users and consistent growth in ad impressions means more advertisers competing for the same attention. When inventory fills up, CPMs rise and the only sustainable way to fight rising CPMs is with creative that earns a lower cost-per-result through strong engagement signals.
Meta’s algorithm rewards ads that hold attention and drive action. It charges more for ads that don’t. Performance creative is what keeps you on the right side of that equation.
Remember: A well-thought performance creative budget that lowers your CPA compounds across every impression you buy. A budget spent on media alone with stale creative doesn’t.
Meta Ads Thrive with Performance Creative Formats
Reels accounting for 50% of time spent on Instagram means the primary ad surface on Meta is now short-form video. That’s a performance creative format, so the creative rules are different: hook in the first two seconds, native-feeling content, no obvious ad tells.
Brands running polished studio ads into Reels are competing against creator-style content that costs a fraction to produce and outperforms them on every engagement metric.
Performance Creatives Fight Ad Fatigue
Daily habits and cross-app overlap (50% of internet users visiting Meta daily, with most using Facebook, Instagram, and WhatsApp interchangeably) means creative fatigue is a real and ongoing threat.
Users seeing the same ad across multiple placements multiple times a week burn through it faster than the algorithm can tell you.
A performance creative system (producing multiple variants per brief, testing them in parallel, rotating in fresh assets before CPMs start climbing) is what keeps frequency from becoming a problem both in terms of efficiency and cost.
Pro tip: If you want help building that creative infrastructure for Meta, inBeat’s performance creative service is built around exactly this: UGC production, hook testing, and creative iteration running alongside your paid media.
Turn Insights into Measurable Growth
The numbers you’ve seen show exactly where Meta’s platforms are performing well and where brand safety still needs work. That’s why you need a partner who can act on this data quickly and with precision.
With inBeat Agency, you get strategies built around proven performance. Our team combines creator-led content, precise Meta ad targeting, and fatigue-resistant ad formats to protect brand perception while driving conversions. From sourcing top-tier micro-influencers to optimizing every ad placement, we handle each step with measurable ROI in mind.
If you’re ready to scale smart on Meta, reach out to inBeat today.
FAQs
How many people use Meta platforms?
As of Q1 2025, you’re looking at 3.43 billion daily active users across Facebook, Instagram, WhatsApp, and Messenger. This scale means you can reach nearly half the global population through a single ad ecosystem.
The key is to segment campaigns smartly. Broad reach only delivers ROI if you match creative and targeting to each audience’s behavior.
How successful are Meta platforms?
Meta platforms are extremely successful. Its success is driven by its ad revenue engine, fueled by billions of active users and precise targeting options. While challenges like shifting engagement and metaverse investments exist, the core social platforms remain dominant.
That dominance gives you competitive leverage, especially if you’re using features like Facebook Reels or Instagram Shop to meet users where they spend the most time.
Is Meta losing users in 2025?
No. Overall growth continues, even with some audience shifts between platforms. For example, younger users might spend more time on Instagram than Facebook, but they remain within Meta’s ecosystem. This means you should watch audience migration trends closely and adjust platform-specific ad budgets rather than pulling spend from Meta entirely.
Is Meta making a profit?
Always. In Q2 2025, revenue reached $47.52 billion, up 22% year-over-year. This strong performance confirms that Meta is still a profitable channel for advertisers. With a healthy ad infrastructure, you benefit from stable targeting tools, ongoing product development, and consistent placement options.