


.svg)
.svg)
.svg)
.svg)

.svg)


Boards and CEOs no longer accept impressions or clicks as proof of impact. Actually, 52% of marketers report that their CEO is paying closer attention to campaigns this year, which raises the stakes for how you present results.
But proving the financial return of your programs can be difficult. This is especially true when customer journeys cut across online and offline touchpoints, and attribution gaps distort the picture.
In this article, we'll show you how to measure, compare, and present marketing impact credibly. But first, let’s look at how ROMI is defined.
TL;DR
ROMI definition: Measures the profit or value generated from marketing spend, unlike ROI (all investments) or ROAS (ad spend only).
Core formula: ROMI = (Net Profit ÷ Marketing Cost). A 200% ROMI means $2 earned for every $1 spent.
Variants:
- Net Profit–based ROMI adds credibility with finance teams.
- CLV-based ROMI shows long-term customer value.
- Gross margin–adjusted ROMI isolates true profitability.
Benefits: Strengthens budget defense, improves allocation, ensures accountability, and builds credibility in privacy-first measurement.
Challenges: Complex attribution, short vs. long-term effects, data silos, and delayed conversions complicate accuracy.
Common errors:
- Over-relying on last-click models
- Ignoring incremental lift
- Skipping finance alignment
- Treating ROMI as a single figure across channels
Advanced frameworks:
- Incrementality testing identifies true campaign lift.
- Marketing Mix Modeling (MMM) links spend to performance over time.
- CLV analysis prioritizes long-term profitability.
- Multi-Touch Attribution (MTA) distributes credit across all touchpoints.
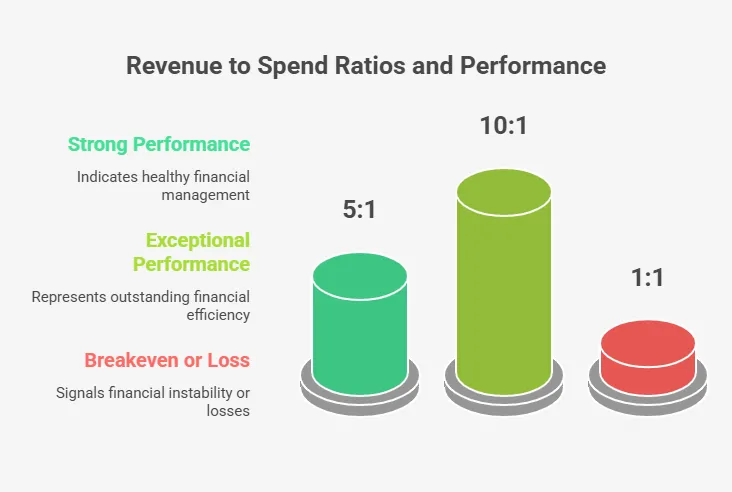
Benchmarks:
- 5:1 revenue-to-spend ratio = strong performance.
- 10:1 = exceptional.
- Sector expectations vary (SaaS > Retail > Finance).
Dashboard essentials: Track spend, CAC, CLV, revenue uplift, and conversion rates with consistency and transparency.
Short vs. long-term ROMI: Combine campaign-level metrics with brand equity and retention for sustainable profitability.
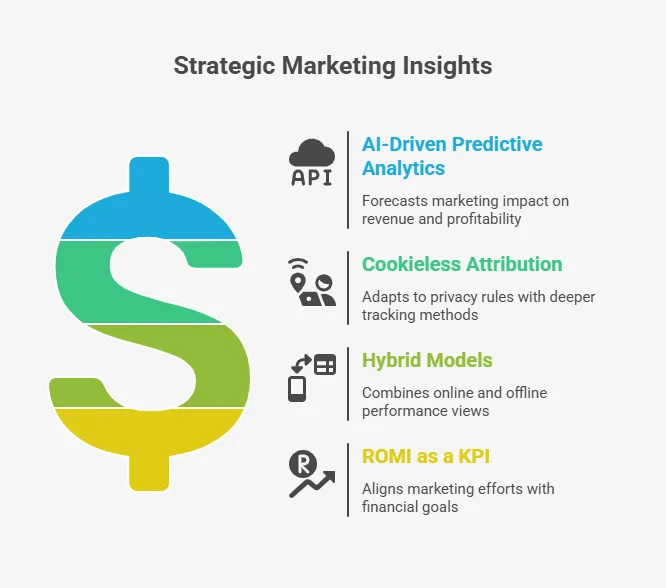
Future outlook: AI-driven analytics, hybrid MMM + MTA models, and cookieless attribution define the next phase of ROMI measurement.
Bottom line: ROMI proves marketing’s financial impact through credible, data-driven frameworks that align CMOs and CFOs on measurable business growth.
What Is Return on Marketing Investment (ROMI)?
Return on Marketing Investment (ROMI) measures how much financial value your marketing activities create compared to what you spend.
And, ROMI is different than ROI or ROAS.
ROI can apply to any type of business investment, while ROAS only measures revenue generated from ad spend. ROMI ties your marketing campaigns directly to profit and long-term value.
This is why finance leaders treat it as a more credible lens for marketing effectiveness.
In one survey of 194 North American marketing leaders, 49% said that they considered ROMI a “very useful” metric. In other words, it’s a metric your leadership team likely expects you to track.
If you’d like a quick visual walkthrough of the concept, you can check out a short YouTube video for more clarity:
How to Calculate ROMI (With Examples)
The core formula for calculating ROMI is:

Example:
- Marketing cost = $10,000
- Incremental revenue = $30,000
- Net profit = $30,000 – $10,000 = $20,000
- ROMI = $20,000 ÷ $10,000 = 2 → or 200%
This means that for every $1 spent, you generated $2 in net return.
However, there are also several variations that you can use for different use cases. Those are:
1. Net Profit vs. Revenue Lens
This approach focuses on net profit after direct costs instead of gross revenue. Here's the formula:
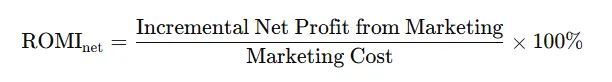
Example:
- Marketing cost = $10,000
- Incremental revenue = $30,000
- Direct costs (goods, fulfillment) = $8,000
- Net profit = $22,000 – $10,000 = $12,000
- ROMI (net) = $12,000 ÷ $10,000 = 1.2 → or 120%
This gives you a conservative figure that finance leaders find more credible.
2. CLV-Based ROMI
This version uses customer lifetime value instead of short-term sales. The formula for this is:
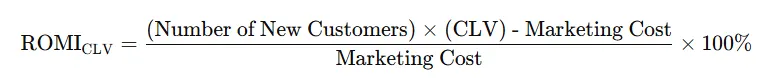
Example:
- Marketing cost = $50,000
- New customers acquired = 500
- CLV per customer = $300
- Lifetime revenue = 500 × $300 = $150,000
- Net profit = $150,000 – $50,000 = $100,000
- ROMI (CLV) = $100,000 ÷ $50,000 = 2 → or 200%
This shows the long-term value of acquisition campaigns, especially in subscription or SaaS models.
3. Gross Profit–Adjusted ROMI
Here, you adjust revenue by gross margin before calculating returns. The formula is:

Example:
- Marketing cost = $10,000
- Campaign revenue = $30,000
- Gross margin = 60%
- Contribution = $30,000 × 0.60 = $18,000
- Net contribution = $18,000 – $10,000 = $8,000
- ROMI (margin) = $8,000 ÷ $10,000 = 0.8 → or 80%
This variant strips out costs marketing cannot control, which gives you a cleaner measure of profitability. Next, let’s look at why tracking ROMI is so important for your business case.
The Benefits of Measuring ROMI
Measuring ROMI shows the real financial impact of your marketing strategy in terms that boards and CFOs care about. Rather than showing them vanity metrics, you can link your spend directly to profitability. Here are the benefits you’ll see:
- Budget justification
Showing profit helps you defend your budget in front of leadership. This can sometimes backfire. In a study of 300 U.S. auto dealerships covering $72 million in media spend, half were found to be overspending in at least one marketing channel. With budget justification, you'll avoid this.
- Smarter allocation
ROMI data tells you where to shift spend. You can reallocate the budget across digital marketing, paid media, or social media when one area underperforms.
- Performance accountability
Linking marketing to pipeline, revenue growth, and customer lifetime value gives leadership confidence that your programs deliver lasting impact.
- Future-proofing
In a privacy-first era, ROMI frameworks help you adapt to attribution gaps and keep reporting credible.
Now, let's move on by discussing why measuring ROMI is usually harder than it seems.
Why Measuring ROMI Is Harder Than It Looks
Measuring Marketing ROI looks simple in theory, but may become a little more complex in practice. That’s because campaigns rarely operate in isolation, and the numbers reported by ad platforms usually miss the full picture. Here's why it's so difficult:
- Attribution complexity
Multi-touch customer touchpoints, walled gardens, and offline conversions make it difficult to know which channel actually drove revenue. A last-click view from Google Ads rarely captures the entire impact.
- Short-term vs. long-term effects
A campaign may drive immediate sales growth, but miss the contribution to brand equity or CLV. Ignoring these trade-offs usually leads to underinvestment in the future pipeline.
- Data fragmentation
Performance data sits in silos (CRM systems, analytics platforms, and ecommerce). This makes it harder for marketing teams to unify marketing measurement and prove credibility with finance. And here's something that you'll probably agree with:
“Marketing without data is like driving with your eyes closed.” - Dan Zarrella, Author and Analytical Marketing Leader
- Conversion lag and baseline adjustments
Not every buying decision happens immediately. Some customers convert weeks later, while baseline sales continue in the background. This can complicate the math.
And not all marketing professionals understand how to measure success. Here’s a video explaining it with concrete data:
Common Mistakes in ROMI Calculation
Even when you attempt a proper marketing ROI calculation, mistakes can happen. Some happen due to flawed attribution, others due to misalignment with finance or overgeneralization. The common mistakes when calculating ROMI are:
- Over-relying on last-click attribution
Many companies still depend on last-click models, but this often hides the true drivers of revenue. Adidas once relied heavily on last-click models from Google Analytics, Adobe, and Facebook. This approach led them to over-invest in digital performance channels such as paid search and display. Then they introduced econometrics, and their brand awareness campaigns drove 65% of sales across wholesale, retail, and ecommerce.
- Ignoring incremental lift
Failing to measure incremental lift can make campaigns look more effective than they really are. Adidas also learned that many of its Dynamic Search Ads were cannibalizing organic website traffic. So, they used Odyssey Attribution to cut spend on low-incremental campaigns and reinvested in generic paid search. This helped the company increase ROI by 12%.
- Not aligning with finance-approved accounting methods
If you only measure return on revenue and ignore gross margin or net profit, the board won’t take the numbers seriously. Finance teams will expect them to line up with accounting standards.
- Treating ROMI as a “one number fits all” metric
ROMI differs across a variety of marketing channels, markets, and time horizons. Presenting one blanket figure oversimplifies reality and risks misleading stakeholders.
How to Measure ROMI with Advanced Frameworks That Leaders Trust
When it comes to proving the financial impact of your marketing, surface-level metrics won’t cut it. You need ways to show what’s really driving results versus what’s just background data. Here are four approaches senior leaders rely on to get a clear picture of marketing’s return.
Incrementality Testing & Lift Studies
Incrementality testing shows whether your campaign truly caused an outcome or simply took credit for it. Techniques such as geo-holdouts, A/B testing, and causal inference compare exposed audiences with control groups to isolate true lift. This is especially important in the privacy-first era, where platform attribution has grown less reliable.
The gap is clear. Only 8% of marketers currently use incrementality testing, which shows how much room there is to strengthen proof of impact. If you skip lift studies, you risk over-crediting campaigns that simply capture organic sales growth.
For example, imagine a paid social media marketing campaign reporting $500,000 in revenue. A control group analysis shows that $300,000 would have happened anyway without ads. The real lift is only $200,000. This difference directly changes how you defend the budget in front of finance.
inBeat Agency can help you set up controlled experiments and geo holdouts to measure the true lift of your campaigns. We focus on proving causality rather than just clicks or impressions.
Marketing Mix Modeling (MMM)
MMM uses econometric modeling to explain how different marketing channels contribute to performance over time. Instead of focusing on last-touch data, MMM accounts for base sales, seasonality, pricing shifts, and external factors like macroeconomic changes. That's why it's valuable for evaluating multi-channel marketing, where offline and online programs interact.
Research shows that MMM can improve marketing ROI by 10-30%. For instance, Lemonade, an insurance-tech company, applied a Bayesian MMM framework to measure the contribution of digital ads, brand marketing, and social media marketing efforts. They explicitly controlled for market trends and base demand.
They then used scenario analysis to see how reallocating spend would change results. That lets them double-check findings against A/B tests and move budgets around with confidence.
inBeat Agency can build media mix models that break down how each channel drives revenue over time. We’ll show you what comes from base sales, seasonality, and campaigns, so you can see exactly where your budget works best.
Customer Lifetime Value (CLV) in ROMI
CLV looks past short-term sales and reframes ROI around the total value a customer brings over the course of their relationship with your business.
This view is critical for subscription and recurring revenue models. Increasing customer loyalty and retention can significantly impact your profitability. Even a 5% jump in retention can raise profits by 25%.
Let's look at the case of a leading finance company that needed to improve marketing segmentation. They used six years of customer and transaction data, applied machine learning models to forecast revenue, and built churn models to predict attrition.
This helped them calculate CLV at the individual customer level and segment their base accordingly. The outcome was a 12% improvement in ROI, 33% better forecast accuracy, and a 50% increase in operational efficiency
Applying CLV-based ROMI lets you identify which marketing tactics attract long-term value and which only drive short-term transactions.
Multi-Touch Attribution (MTA) vs. Last-Touch Models
CLV and MMM help you measure long-term impact, but you still need attribution for day-to-day decisions. Multi-Touch Attribution (MTA) spreads credit across the funnel instead of handing it all to the last click. That way, you can see how things like content, email, or Google Search Ads each play a role in moving someone toward a purchase.
The trade-off is complexity. MTA requires clean customer journey tracking, integration with CRM systems, and typically specialized marketing software.
But despite its limitations, it offers more actionable insight than last-touch. The fact that 41% of marketers still use last-touch models shows how many are stuck with outdated views that finance teams are unlikely to trust.
inBeat can help you evaluate whether MTA or MMM is a better fit for your marketing goals. We focus on making data-driven decisions that balance useful insights with what’s practical to execute.
Pro tip: You can learn more about these approaches in our guide on MMM vs MTA.
Key ROMI Benchmarks & Industry Standards
You cannot defend your marketing expenditure without benchmarks that finance recognizes. According to Oracle, a common rule of thumb is that a 5:1 revenue-to-spend ratio shows strong performance, while 10:1 is exceptional. At 1:1 or below, you’re just breaking even, or worse, losing money.
Benchmarks also shift by sector. A SaaS company may expect higher ROMI due to subscription revenue and lower customer acquisition costs. At the same time, retail usually works with slimmer margins and different conversion rates. In finance, regulations and longer sales cycles can delay measurement, but still demand clarity for boards.
To set internal standards, you need more than external averages. Comparing against your own year-over-year results, competitor data, and key digital marketing KPIs allows you to define what good looks like for your specific context. In fact, 48% of organizations internally benchmark departmental or business unit data, showing many see the value in comparing against themselves first.
This keeps you from chasing blanket targets that mislead decision‑makers, and gives you control over what really counts as marketing success.
Building a ROMI Dashboard That CFOs Trust
If you're trying to get leadership on board, you need a dashboard that presents financial impact with clarity and consistency. Tools like GA4, Looker Studio, and Power BI can help you bring all your data together, but the credibility of the output depends on what you track.
A finance-ready dashboard should bring together marketing expenditure, sales uplift, customer acquisition cost, and customer lifetime value. Adding metrics such as sales conversion rates or cost per lead allows you to show how individual campaigns contribute to revenue and not just traffic or clicks.
The truth is, CFOs care about whether spend translates into measurable profitability of marketing campaigns (not vanity metrics).
And, consistency ensures month-to-month comparability. At the same time, transparency lets finance teams validate assumptions behind the data. When you apply these principles, your dashboard becomes a tool for better marketing ROI measurements and not just reporting.
Short-Term vs. Long-Term ROMI
Measuring ROMI isn’t just about showing the quick return from a single campaign.
Short-term ROI highlights how specific marketing assets drive pipeline growth, but if you rely only on those numbers, you risk chasing quick wins at the expense of long-term gains. In fact, 83% of marketing leaders say demonstrating ROI is their top priority these days, a focus that can push brands to under-invest in customer relationships and loyalty that actually fuel future revenue.
Companies that balance near-term activations with brand-building usually hold up better during downturns. That’s because short-term metrics like cost per acquisition or engagement only tell part of the story, while long-term signals such as retention and repeat purchases directly shape marketing ROI.
So what can you do? You need to integrate both views into your reporting. Align B2C or B2B marketing strategies and consumer-facing initiatives by combining campaign-level results with clear performance metrics.
Track equity growth, loyalty, and company growth over time to balance short-term and long-term impact. This balance prevents overcorrection and creates a path to sustainable profitability.
Pro tip: You can use this cost per acquisition calculator to calculate your CTA.
Preparing for the Future of ROMI Measurement
The way we measure ROMI is changing quickly as technology, privacy rules, and board expectations evolve. To stay ahead, you need to be ready for the next generation of measurement frameworks.
AI-driven predictive analytics lets you forecast how marketing across channels will impact revenue and profit. That’s key, because CFOs want forward-looking clarity, not reports on what already happened.
At the same time, cookieless attribution and privacy rules mean you can no longer rely on simple tracking of traffic sources or the percentage of visitors. So, you need deeper methods that connect signals across fragmented systems.
Hybrid models that combine Marketing Mix Modeling with marketing attribution offer a unified view of both online and offline performance. You can factor in seasonality, brand equity, and future campaigns alongside direct pipeline impact. In fact, 61.4% of marketers now say improving media mix modeling is a top priority, which speaks to how important that macro view is.
ROMI is also becoming a core KPI for CFO/CMO alignment. When you show how each target audience interaction ties to profit, you gain stronger budget authority and credibility with finance.
Proving this future-ready approach means using marketing automation tools and agencies, CRM systems, and marketing mix software with predictive models built in. These tools give you more reliable reporting, improve marketing ROI, and help you allocate budgets more intelligently before the money is spent.
Wrapping Up
ROMI has become the currency of marketing accountability because it links spend directly to business impact that both CFOs and CMOs can act on. But using a simple ROI formula is just the starting point.
The real credibility comes from frameworks like incrementality testing, Marketing Mix Modeling, and CLV-based analysis that show cause and effect. When you use these methods, you prove the true ability of marketing campaigns to drive sustainable outcomes.
Partner with inBeat Agency to measure and maximize your marketing ROI. Our team uses advanced analytics, custom dashboards, and testing frameworks to give you clear visibility into what works, optimize spend across channels, and tie every campaign back to real business results.
FAQs
What’s a good ROI for marketing?
A strong return depends on your category, but WARC’s ROI Benchmarks Report (1,537 case studies) found median revenue returns of around 4.33:1 and median profit ROI of 2.5:1 for a successful marketing campaign. These benchmarks give you a reference point when presenting results to finance teams.
How is ROI measured in digital marketing?
You measure ROI by linking spend with outcomes such as conversion paths, customer equity, or incremental revenue. That usually means going beyond clicks and using popular marketing analytics platforms, attribution tools, or controlled tests. When you include both costs and results in your model, you present a figure your CFO can trust.
Is ROI the same as ROMI?
ROI looks at overall profit relative to investment. ROMI narrows that to marketing spend. The difference matters because ROMI isolates marketing outcomes without blurring in operational or product costs. This makes it a sharper tool for accountability.
What is a normal ROMI?
In practice, 100%-300% counts as moderate, 300%-500% as high, and 500%+ as excellent. Treat these ranges as benchmarks, but adjust expectations by industry and the maturity of your brand.