


.svg)
.svg)
.svg)
.svg)

.svg)


Are you someone who tracks dozens of numbers, yet renewal calls still feel harder than they should? Reports may look solid, but decisions lag, and the cause is unclear. And when results dip, the story weakens instead of guiding the next move.
The real issue is not volume but signal. Most marketing agency metrics reward activity rather than outcomes tied to revenue growth or customer retention.
So this guide narrows the field to metrics that explain what changed, why it changed, and what to do next. Here, you’ll see how to cut noise and link creative and media choices to outcomes.
TL;DR: A Quick Snapshot
- Tracking more metrics does not improve decisions, but clearer signals do.
- Strong agency reporting explains what changed, why it changed, and what to do next.
- Separate internal health metrics from client-facing outcome metrics.
- Platform numbers show activity, but clients judge impact and risk.
- Tie every metric to a decision rather than a dashboard.
- Use the Goal → Signal → Metric → Action flow to keep logic tight.
- Revenue, pipeline, and funnel metrics defend value in renewals.
- Creative and paid metrics explain why performance shifts, and not just that it did.
- Avoid vanity metrics that drive no action.
- Fewer, stable metrics create confidence, faster decisions, and stronger client trust.
What Are Marketing Agency Metrics?
Marketing agency metrics are the numbers you use to judge whether your work drives real business movement.
At a high level, they fall into two groups. Internal metrics support agency management by covering delivery health, margins, and risk. Client-facing metrics concentrate on outcomes, such as client acquisition or revenue signals tied to a marketing campaign.
However, platform key performance indicators on their own rarely answer the questions clients care about. Clicks, views, or reach describe activity, but they don’t really explain impact.
As a result, many leaders struggle to defend results even when reports are strong. In fact, 47% of CMOs state that they have trouble presenting the true business impact of their marketing. This explains why performance-focused reports matter more than raw numbers.
Also, feel free to take a look at this short clip to see why raw numbers without context rarely help:
This leads us to our next point.
Why Most Agencies Struggle With Marketing Metrics
Most agencies struggle with marketing metrics because the numbers explain activity but fail to explain decisions. On paper, reporting looks thorough. But in practice, clarity breaks down once results need to be defended.
Here are the main reasons that the gap shows up:
- Too many metrics, not enough meaning: Dashboards grow over time, yet each added metric weakens focus. As a result, priority signals get buried.
- Reporting what platforms show instead of what clients need: Platform views shape reports for digital marketing agencies, but the views rarely match how clients judge progress or risk.
- Vanity metrics vs. decision metrics: Reach or brand awareness can look healthy, but without downstream proof, they stall conversations. That tension is real, especially since 36% of CFOs say vanity metrics are one of their biggest reporting concerns.
- No link between creative, spend, and results: When creative and media signals stay separate, changes in conversion rates feel random rather than explainable.
- Renewal pressure builds quietly: Over time, weak metric logic impacts renewals and client proposals.
How to Choose the Right Marketing Agency Metrics for Each Client
You choose better metrics when each one has a clear job tied to a decision. So, instead of starting with tools or reports, you should anchor your thinking in a simple flow that forces cause and effect.
Here's a framework you can use:
- Goal: What the client actually wants, such as steady monthly recurring revenue or a predictable pipeline velocity.
- Signal: The change that would prove progress, like higher intent or shorter sales cycles.
- Metric: The number that captures that signal, for example, marketing-qualified leads or qualified demo requests.
- Action: What the team changes if the number moves, whether that’s creative direction, spend allocation, or pacing.
In practice, this keeps metrics grounded. If the goal is awareness, the signal might be rising website traffic from priority accounts. The metric tracks that lift, and the action focuses on creative angles that sustain reach without wasting spend.
If the goal is sales, the signal shifts to lead quality. As a result, tracking sales-qualified leads clarifies whether a campaign drives real campaign success or just volume.
Moving on, we'll cover the metrics that matter.
The 20 Marketing Agency Metrics That Matter Most
At this point, the focus shifts from framing to choice. So, you need metrics that hold up in real reviews, explain movement in net margin, and guide action. Below are the categories that separate signal from noise.
Category 1: Growth & Revenue Metrics
This category sits closest to money and renewal risk. These metrics help you explain whether work contributes to growth. Here are the core signals that tie spend, output, and revenue together.
1. Customer Acquisition Cost (CAC)
CAC shows how much it costs to win a new customer, all in. It matters because it sets the boundary for sustainable growth and frames every efficiency conversation. When tracked over time and by channel, it shows real value.
When CAC rises faster than annual recurring revenue, pressure builds quietly. So, you can use it early in relationships to validate assumptions and later to explain why scale slows or accelerates.
Example: With Genomelink, inBeat tracked CAC by channel and creative and saw a 73% reduction after shifting spend toward higher-performing UGC hooks and formats. That CAC trend made it clear which assumptions were wrong early on and gave the team confidence to scale without guessing.
2. Return on Ad Spend (ROAS)
ROAS links revenue to paid activity, which makes it both useful and risky. A healthy range falls between 2:1 and 4:1, but context matters too. Lower ratios can still support growth during testing or expansion phases. Higher ratios can hide stalled volume.
You can use ROAS when revenue attribution is stable and timing is clear. But avoid it when lag or mixed channels distort cause and effect.
Example: For Hurom, inBeat improved ROAS by 2.5x after replacing polished ads with performance-focused UGC and reallocating spend to creatives that hold attention longer. That ROAS lift only became useful once revenue timing stabilized, which helped the team separate real efficiency gains from short-term spikes.
3. Revenue Influenced by Marketing
This metric captures revenue touched by marketing (not claimed by it). That distinction matters in longer cycles where deals involve many inputs. It helps explain contribution without overstating credit.
As a result, conversations shift from proof to alignment. So, feel free to use it when clients question value despite a steady pipeline. And tie it back to operating profit rather than surface totals.
4. Pipeline Value Generated
Pipeline value shows how much potential revenue enters the funnel due to your work. It matters because it connects top-of-funnel effort to future cash flow.
When tracked consistently, it explains momentum shifts before revenue moves. You can use it in B2B or high-consideration sales, especially when clients focus on the break-even point rather than short-term wins.
5. Cost Per Lead (CPL)
CPL measures efficiency, but only when paired with quality. For 2025, the average B2B CPL sits near $84. Cheap leads typically stall later stages, which increases sales friction.
You can use CPL to control volume and pacing. Then you can connect leads to opportunities to explain why lower cost does not always mean better outcomes.
Category 2: Conversion & Funnel Metrics
This category explains movement between intent and revenue. These metrics help you pinpoint where momentum builds, where it stalls, and why outcomes shift even when spend stays flat. Below are the signals that connect traffic, leads, and sales logic.
6. Conversion Rate (by channel)
Conversion rate by channel shows us how well each source converts interest into action. It matters because it exposes weak links that volume alone hides. For context, average website conversion rates are often between 1.5% and 2.5%, which helps frame expectations without locking you into targets.
But the real value comes from comparison. You can use this when judging digital marketing mix quality or explaining why traffic growth did not improve results.
Example: For Stronger by the Day, inBeat used creator-led UGC across paid social to test which channels turned interest into real action. That approach drove a 6.80% conversion rate for the specific UGC content below. This clearly outperformed typical channel benchmarks and showed where traffic quality actually lived.
7. Lead-to-Customer Rate
Lead-to-customer rate tracks how many leads actually become paying clients. That gap is where trust usually erodes. While the average sits near 5% across industries, the number only matters relative to source and intent.
So if leads rise but revenue stalls, this metric explains why. You can use it to connect funnel quality to win rates and to clarify whether issues sit with targeting, messaging, or handoff.
8. Landing Page Conversion Rate
Landing page conversion rate isolates message fit and clarity. It matters because paid and organic traffic typically work fine, yet results fail at the page level. In practice, this metric helps separate creative problems from channel problems.
Use it when testing offers, layouts, or proof points, especially across your search engine optimization strategy and paid traffic, where small changes can shift downstream performance.
9. Drop-off Rate Between Funnel Stages
The drop-off rate shows where prospects disengage between steps. That insight matters because losses rarely happen evenly. As a result, blaming volume misses the point. When one stage bleeds faster than others, the fix is specific.
You can use this metric to guide copy changes, qualification rules, or follow-up timing across email marketing and sales workflows.
10. Time to First Conversion
Time to first conversion measures how long it takes for someone to act after first contact. It matters because long delays increase risk and cost. Shorter timelines usually signal clearer value and better alignment.
Use this when diagnosing slow pipelines or explaining why spend increases have not translated into faster results.
Category 3: Creative & Content Performance Metrics
This category is all about whether creative work actually holds weight. These metrics help you distinguish strong ideas and tie content choices to business impact. Here are the signals that show how creative performs once it meets the market.
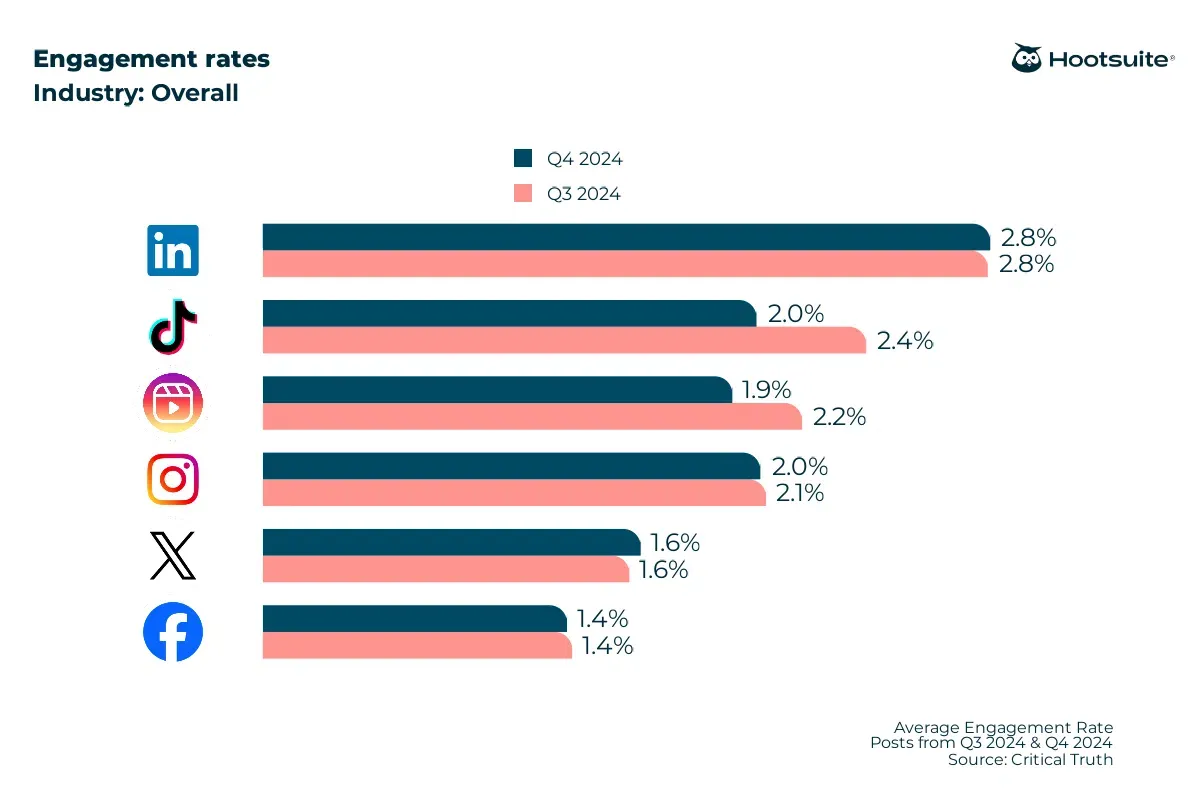
11. Engagement Rate (Normalized)
Normalized engagement rate adjusts for reach, format, and platform differences. That matters because raw likes hide weak creative behind inflated distribution. For context, average engagement across major platforms is around 1.4%-2.8%, depending on network and format.
However, the real value shows up when comparing assets side by side. In practice, this clarifies which ideas need scale across social media and which you should stop early.
Example: For NYC Votes, inBeat worked with 10 local creators on TikTok and reached 2.5 million views while maintaining a 70% average view-through rate. Normalizing engagement across creators made it clear which videos truly held attention during the NYC influencer campaign.
12. Thumb-Stop Rate / Hook Rate (Video)
Thumb-stop rate measures whether the first seconds earn attention. It matters because most creative fails before messaging even begins. When the hook rate drops, spend efficiency erodes regardless of targeting quality.
As a result, this metric helps explain why performance shifts without blaming the media. It works best during testing phases, where fast feedback guides edits before delivery costs can hurt delivery margin.
13. Cost Per Content Asset
Cost per content asset tracks how much each piece costs after production, revisions, and approvals. That clarity matters because creative spend usually hides inside time.
This metric helps you connect creative output to utilization rate and decide where volume makes sense versus where focus does.
14. Creative Fatigue Rate
Creative fatigue rate measures how quickly performance drops when exposure rises. It matters because repetition erodes impact long before budgets run out. When fatigue accelerates, results fall even with stable spend.
In other words, this metric explains the decay that attribution misses. It becomes most useful during scale, where refresh timing protects outcomes without inflating the margin of error.
Pro tip: If you don't know what this is, you can check out our guide on Facebook creative fatigue to learn more.
Category 4: Paid Media Efficiency Metrics
This category shows whether paid spend turns into leverage or leakage. These metrics help explain cost shifts, creative impact, and pacing decisions once budgets scale. Here are the signals that keep paid media tied to outcomes.
15. Cost Per Click (CPC)
CPC tracks how much attention costs before conversion enters the picture. It matters because rising CPC narrows the margin long before revenue drops. For context, 2025 averages on Google Search are around $2.41-$4.66 per click across industries, which frames market pressure rather than targets.
However, the signal leads to opportunities when paired with creative or intent changes. In practice, CPC helps explain cost swings across channels.
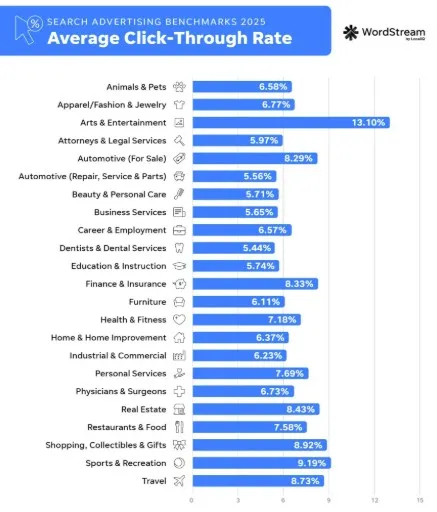
16. Click-Through Rate (CTR)
CTR shows whether ads earn interest once shown. That matters because strong targeting fails without message fit. In 2025, the average Google Ads CTR is about 6.66%, which sets a baseline for diagnosing underperformance.
But the real insight comes from movement over time. When CTR drops, spend efficiency erodes first. As a result, this metric guides creative iteration before budget cuts ripple into net profit.
17. Frequency vs. Performance Decay
This metric compares how frequently people see ads against how results change. It matters because repetition reduces impact quietly. When frequency rises, but outcomes fall, performance decay explains the gap.
So rather than blaming platforms, this signal points to refresh timing. It works best during scale phases, where pacing decisions protect results without inflating pass-through expenses tied to wasted impressions.
18. Spend Efficiency by Creative Variant
Spend efficiency by creative variant shows which ideas convert budget into outcomes. That clarity matters because blended averages hide winners and losers. When one variant absorbs spend without lift, overall performance drifts.
In other words, this metric connects creative choice to media efficiency. It supports faster calls on rotation and helps align media decisions with resource planning.
Category 5: Client Health & Retention Metrics
This category reflects trust over time. These metrics show whether results hold up beyond monthly reports and whether relationships grow or quietly weaken. Here are the signals that matter once delivery meets expectations.
19. Client Retention Rate
Client retention rate tracks how long relationships last and how stable the revenue is. That matters because churn rate typically signals issues before performance drops.
Industry data from Ravetree shows the average agency-client relationship lasts about 2-3 years, with roughly 34% of agencies retaining clients for 2-5 years.
In practice, this metric helps each agency owner spot risk early and tie retention to client satisfaction and delivery consistency.
20. Client Lifetime Value (CLV)
Client lifetime value, usually discussed alongside customer lifetime value, measures total revenue per client across the relationship. It matters because growth without longevity strains teams. A common benchmark targets a CLV-to-CAC ratio near 3:1, which frames sustainability rather than speed.
As a result, CLV connects pricing, scope discipline, and planned capacity. When tracked consistently, it supports decisions that build a better agency rather than just bigger contracts.
Marketing Agency Metrics That Look Good but Rarely Help
Some metrics feel reassuring at first glance. They create the sense that work is moving, even when decisions stay unchanged. However, that comfort fades quickly once results are questioned.
Here are the metrics that usually add noise instead of clarity:
- Impressions without outcomes: High reach suggests visibility, but without downstream signals, it explains nothing about impact.
- Follower growth alone: Growth looks positive, yet it rarely connects to demand or revenue. So when budgets tighten, this number offers no direction.
- Average engagement without benchmarks: Engagement means little without context. Without comparison, it becomes impossible to tell whether the creative is improving or just maintaining baseline interest.
- Platform “scorecards” with no action plan: Platform summaries highlight activity rather than decisions. That’s where trust erodes, because numbers appear polished but lead nowhere.
Pro tip: Check out our performance marketing guide to learn how it works and how to use it to your advantage.
Why You Need a Performance Creative Reporting Framework to Interpret Marketing Metrics
Marketing metrics become much more useful when you can trace them back to the creative choices that influenced them. Pairing these insights with AI survey tools can also help validate customer sentiment and explain why certain creative decisions performed better than others.
That is the problem many agency reports still fail to solve. They show CTR in one place, CAC in another, and creative assets somewhere else entirely. So when results improve or decline, the report describes movement without explaining what caused it.
A performance creative reporting framework fixes that gap. It helps you read marketing metrics as signals connected to specific creative decisions, such as the hook, message angle, creator type, proof element, visual structure, or refresh timing.
That matters because clients want to know why they got certain results, whether they can be repeated, and what should change next.
Here’s a simple way to build that logic into your reporting.
Step 1: Start with the business outcome
Before you look at assets, define the business result the creative is supposed to influence. That could be lower CAC, higher conversion rate, better ROAS, stronger lead quality, or a shorter time to first conversion.
This step prevents creative reporting from drifting into surface-level commentary.
- If you start with asset count, approvals, or vague creative quality judgments, you end up describing activity.
- If you start with the business outcome, you can evaluate creative based on whether it actually improved performance.
This is what makes the framework performance-led from the start: the creative is being judged by the result it’s meant to support.
Step 2: Identify the creative variable most likely to affect that outcome
Once your business goal is clear, identify which creative variable is most likely influencing it. For example:
- A weak hook may be hurting CTR.
- Unclear product framing may be lowering landing page conversion.
- Weak proof may be increasing CPA.
- Repetitive visuals may be causing fatigue and performance decay.
- The wrong creator style may be attracting clicks but weak lead quality.
Here, you’re basically creating a bridge between the metric and the creative. Without that bridge, teams tend to blame “the campaign” in general, which makes optimization vague and slow. With it, you can start forming real hypotheses about what changed and why.
Step 3: Match each metric to the part of the creative journey it actually reflects
Not every metric tells you the same kind of story. Some metrics reflect attention. Others reflect persuasion. Others reflect efficiency over time.
A clearer framework usually looks like this:
- Attention metrics: thumb-stop rate, hook rate, CTR, normalized engagement
- Message-fit metrics: landing page conversion rate, lead-to-customer rate, time to first conversion
- Efficiency metrics: CAC, CPL, ROAS, spend efficiency by creative variant
- Decay metrics: frequency versus performance decay, creative fatigue rate
This process helps you interpret numbers correctly. A falling CTR usually points to an attention or relevance problem. A stable CTR with rising CPA may point to a trust, offer, or conversion problem. Frequency rising while results weaken points to fatigue rather than targeting failure.
When metrics are tied to the role each part of the creative plays, they become much easier to read and defend.
Step 4: Compare creative variants, not just channel averages
Blended averages hide too much. A channel can look flat while one creative is carrying performance and another is quietly draining spend.
That’s why we advise you to compare metrics by creative variant. Look at which hooks, creators, proof structures, messages, or visual treatments actually improved outcomes.
This step turns creative into a measurable lever.
You stop asking whether Meta or TikTok “worked” in general and start asking which creative choices within those channels drove better results. That makes optimization far more precise and gives clients a clearer explanation of what deserves more scale.
It also protects you from vague conclusions like “UGC works better” when the reality may be that one specific UGC angle worked better than a polished ad in one stage of the funnel.
Step 5: Use the metrics to make one clear next decision
A performance creative reporting framework should always end in action.
Once you know which business outcome matters, which creative variable likely influenced it, how the relevant metrics moved, and which variant performed best, the report should make the next move obvious.
That decision might be:
- Scale one creative angle.
- Replace a weak hook.
- Refresh a fatigued asset.
- Shift budget toward a higher-efficiency variant.
- Add more proof to improve CVR.
- Separate cold and warm audience messaging more clearly.
Reporting is only valuable if it improves decisions. Without the action layer, even accurate analysis stays passive. With it, metrics become operational. They help the team know what to keep, what to fix, and what to stop.
Remember: That’s what clients usually mean when they ask for better reporting. They don’t want more numbers. They want more confidence in the next move.
Why this framework improves how you interpret marketing metrics
Marketing metrics on their own tell you if performance changed. A performance creative reporting framework helps you understand what inside the creative likely caused that change.
Those are the real benefits:
- It gives structure to metrics that otherwise feel disconnected.
- It makes creative easier to defend because it links assets to outcomes.
- It makes reporting more useful in renewal conversations because it shows not only what happened, but how the agency thinks and what it will do next.
And all that leads to better optimization, faster decisions, and stronger client trust.
How inBeat Helps You Turn Metrics Into Clear Decisions
If reporting feels heavy but still fails to guide action, support usually breaks down between creative, media, and measurement. inBeat Agency helps close that gap by tying those parts together around a small set of metrics that actually explain change.
The work starts with creator-led content built to earn attention naturally. Only the assets that show an early signal get scaled with paid media. From there, metrics guide every decision. This includes which creatives deserve more budget, when spending should slow, and how results connect back to outcomes clients care about.
For example, our Dockers campaign shows this in practice. Over an 11-month program involving 82 creators, creative performance data guided which assets earned paid scale. After a strategy shift, that approach helped drive 15.8 million views and more than a 2x lift in ad recall.
These are some of the results we achieved:
That clarity made it easier to explain results, adjust direction mid-campaign, and keep confidence high during reviews. This approach can also help you focus on what moves performance forward and ignore what does not.
Here's an example of our work with Dockers:
What to Do Next With Your Metrics
Metrics work best when they guide judgment. When fewer signals stay consistent, reporting turns into direction instead of defense. As a result, conversations go from explaining numbers to explaining decisions. That clarity protects trust, especially when results change.
If reporting still creates effort without clear direction, support can help close the gap. inBeat Agency works with teams to connect creative choices, spend, and outcomes through metrics that hold up under pressure.
Reach out to our team so you can see how that approach fits your work.