


.svg)
.svg)
.svg)
.svg)

.svg)


If you are running an e-commerce brand in New York City, paid social media directly shapes your customer acquisition cost and growth marketing results.
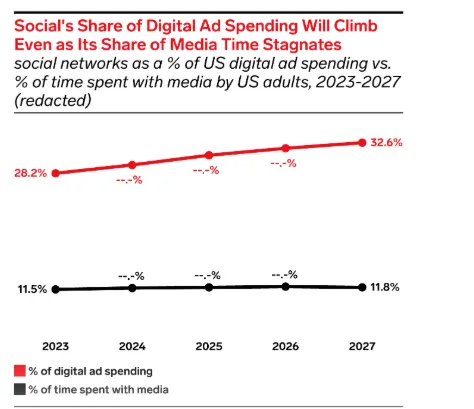
According to an eMarketer forecast, social networks will account for 32.6% of all US digital ad spending by 2027, up from 28.2% in 2023. This means a larger share of online advertising budgets is flowing into social media platforms like Meta, TikTok, and LinkedIn.
At the same time, time spent with media remains nearly flat at around 11 to 12%. Users are not dramatically increasing how long they scroll. Attention is not expanding at the same pace as ad budgets.
As a result, more money competes for roughly the same amount of attention.
In a city like New York City, where digital marketing competition is already intense, this pressure shows up quickly in your performance metrics.
And to stay efficient, you need clear benchmarks for CPM, CTR, conversion rate, and ROAS across Meta, TikTok, and LinkedIn so you can evaluate whether your campaigns are actually working.
In this guide, you will get:
- Current Meta and TikTok benchmarks* for core performance metrics
- Industry and funnel stage comparisons
- NYC-specific factors that affect campaign structures and costs
- Practical guidance on setting targets and improving business outcomes
P.S. Is your paid social spend climbing while revenue stays flat? inBeat Agency aligns creative testing, performance data, and structured campaign execution to turn paid social into a predictable revenue channel. Book a free strategy call now.
*Note: Paid social platforms do not publicly publish city-specific benchmark datasets. The numbers below reflect national ecommerce benchmarks, with NYC-specific context layered for interpretation.
Key Takeaways
- National paid social benchmarks provide context, but NYC auction pressure often skews costs higher.
- CPM should be evaluated alongside CTR and conversion rate, not in isolation.
- Strong CTR signals effective audience segmentation and compelling ad creative.
- Elevated CPC can be sustainable if customer lifetime value supports acquisition costs.
- ROAS must be interpreted within the margin structure and funnel performance.
- Creative fatigue moves faster in competitive markets like New York City.
- Each funnel stage requires different primary performance metrics.
- Industry benchmarks offer better guidance than platform averages alone.
Why Paid Social Benchmarks Matter for NYC Ecommerce Brands
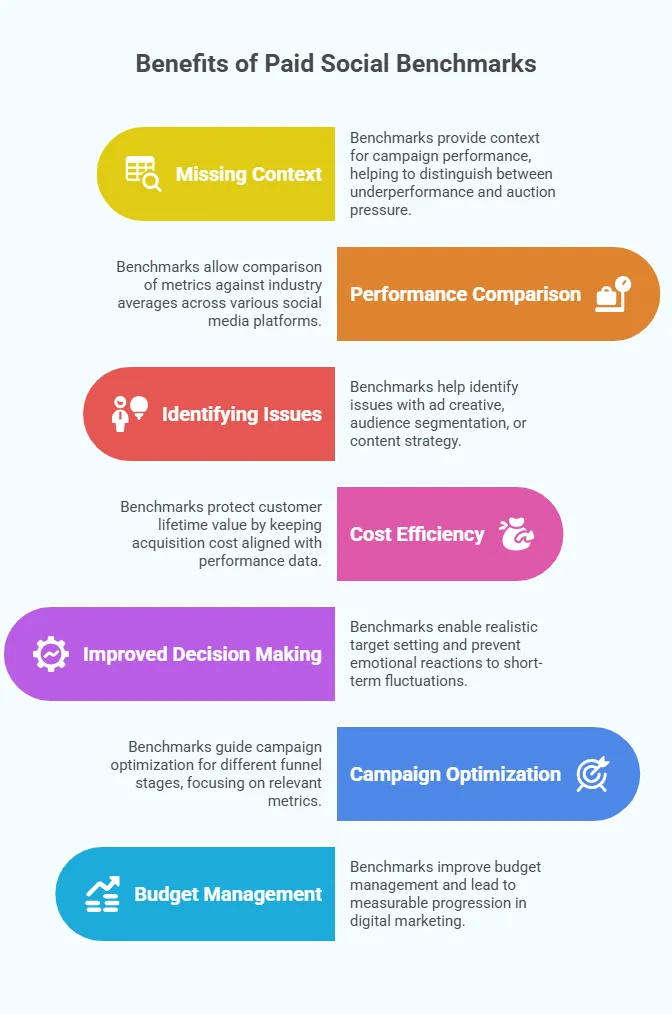
When you run paid social in New York City without knowing the benchmarks, you put yourself at a disadvantage. CPM may shift, CTR can dip, and customer acquisition cost creep up. Without proper context, you cannot tell whether your campaigns are underperforming or whether auction pressure simply increased.
Paid social benchmarks give you that missing context. They let you compare your performance metrics against real ecommerce averages across Meta, TikTok, and other social media platforms.
For example, if your CTR sits at 0.6% while industry averages hover near 1%, that usually signals an ad creative, audience segmentation, or content strategy issue. And if your CPM rises while conversion rate holds steady, the pressure likely comes from competition rather than execution.
Remember that in New York City, cost efficiency is not optional. You compete with national brands, local Shopify stores, and performance-focused NYC agencies inside the same platform algorithms. Following the benchmarks helps you protect customer lifetime value by keeping customer acquisition cost aligned with real performance data.
Plus, tracking them improves how you make decisions. You can set realistic targets for each funnel stage instead of reacting emotionally to short-term swings (we’ll discuss this in detail later).
- Awareness campaigns focus on CPM and reach.
- Consideration campaigns prioritize CTR and engagement.
- Conversion campaigns require strong ROAS, reliable conversion tracking, and disciplined campaign structures.
We have seen this repeatedly while working with various teams. Teams that anchor decisions in benchmarks manage their budgets better and make measurable progress. In New York’s competitive digital marketing space, that clarity makes paid social far more sustainable.
Paid Social Benchmarks for NYC Ecommerce Brands (Meta + TikTok)
Before you set performance goals, you need to understand what “normal” looks like across the dominant social media platforms. We have taken the data below from Lebesgue and WebFX. It reflects national e-commerce benchmark summaries and industry reporting. Treat them as baselines, not guarantees.
1. CPM Benchmarks for NYC Ecommerce Brands
CPM (cost per 1,000 impressions) tells you how expensive it is to get in front of your audience. It reflects auction pressure, targeting precision, and overall advertiser competition across social media platforms. If CPM rises too quickly, your entire acquisition model tightens because every impression costs more.
Here’s what national ecommerce CPM benchmarks currently look like:
Meta CPMs typically sit in the high single digits nationally, while TikTok usually trends lower at awareness and early conversion stages.
What This Means for NYC E-commerce Brands
In New York City, CPM frequently trends above these baselines. CPMs in NYC may be higher due to:
- Higher advertiser density
- Strong DTC brand concentration
- Financial, fashion, and luxury vertical competition
- Aggressive Q4 retail spend
If your CPM exceeds national averages, that does not automatically signal a broken campaign. Higher CPM can be acceptable if your CTR and conversion rate remain strong. We suggest evaluating impression cost alongside downstream performance metrics before making structural changes.
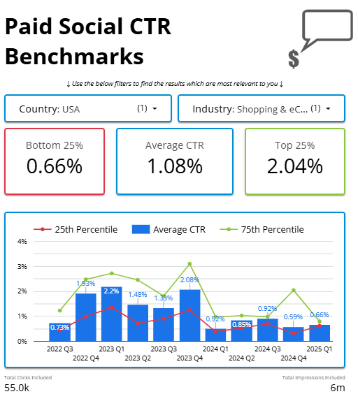
2. CTR Benchmarks for NYC Ecommerce Brands
CTR (click-through rate) is usually the fastest performance signal you can measure. It tells you whether your content strategy, audience segmentation, and offer are resonating.
According to Search Engine Land benchmark tracking for the USA shopping and ecommerce industry, the average paid social CTR sits at 1.08%, with top quartile brands reaching 2.04%. This gap shows how strong creative and audience alignment can move the needle.
Now let’s explore how platform-level national benchmarks typically stack up:
Remember that CTR varies significantly based on placement, creative content, audience targeting, and offer structure.
What This Means for NYC E-commerce Brands
If your CTR falls below 0.6% in New York City, your ad creative or audience targeting likely needs attention. While the market is competitive, strong performance creative still stands out when messaging and segmentation are aligned.
At the same time, NYC audiences are exposed to a higher volume of ads every day. That constant exposure accelerates creative fatigue. As a result, your content production and creative testing cycles need to move faster than in less saturated markets.
Reaching 1% or higher in NYC is a healthy signal that your messaging is resonating. And sustaining performance near 2% typically reflects strong audience alignment, compelling offers, and disciplined optimization.
3. CPC Benchmarks for NYC Ecommerce Brands
CPC (cost per click) shows how much you are paying for each click to your landing page. It reflects both auction competition and how compelling your ad creative and audience segmentation are. Because CPC directly influences customer acquisition cost, even small increases can tighten your margins if conversion rates stay flat.
These national ecommerce benchmarks give you a baseline reference point:
Instagram Feed frequently trends higher due to placement demand and advertiser concentration.
What This Means for NYC E-commerce Brands
In New York City, CPC can exceed these national baselines when:
- Multiple brands target overlapping high-income audiences
- Event-driven campaigns stack in similar timeframes
- Premium lifestyle and luxury brands compete aggressively
If your CPC is elevated but the conversion rate remains strong, the issue may not be cost. It may reflect acceptable acquisition economics relative to customer lifetime value.
However, if CPC rises and conversion rate declines at the same time, you likely have a creative alignment or targeting issue. In that case, we recommend reviewing your ad creative, landing page experience, and campaign structures before increasing spend.
4. Conversion Rate & ROAS Benchmarks for NYC Ecommerce Brands
If CPM tells you the cost of attention and CPC tells you the cost of action, conversion rate and ROAS tell you whether your paid social efforts are actually profitable. These metrics connect platform performance to real business outcomes.
Here are the national ecommerce baseline ranges:
An average ROAS of 2.87 means you generate $2.87 in revenue for every $1 spent. Whether that is healthy depends on margin structure and customer lifetime value.
What This Means for NYC E-commerce Brands
Conversion performance in New York City often reflects strong purchase intent in fashion, beauty, wellness, and premium consumer categories. At the same time, media costs are typically higher.
If your ROAS sits in the 2.5 to 3.0 range, you are within sustainable national territory. Profitability, however, depends on several factors:
- Customer lifetime value
- Landing page experience
- Conversion tracking accuracy
- Campaign structures and retargeting strategy
In NYC, small improvements in UX design, audience insights, or pixel-based retargeting can shift profitability quickly because baseline acquisition costs are already elevated. We have seen that when media is expensive, efficiency on the landing page and in your funnel becomes even more important.
Paid Social Ecommerce Benchmarks by Industry for Ecommerce Brands
Platform averages only tell part of the story. Performance metrics vary significantly by industry. A fashion brand will not behave like a pet supply company, and a wellness brand will not convert like automotive.
Let’s explore how paid social performance breaks down by industry, based on aggregated reporting from Triple Whale.
What This Means for NYC E-commerce Brands
The above are national baselines. In New York City, you mostly see:
- A higher CPM than these medians
- Tighter CPA targets due to elevated media costs
- Faster creative fatigue cycles
For example, Health & Beauty shows a national ROAS of 1.83 and CPM of $16.24. In NYC, CPM can trend even higher due to luxury brand concentration and intense DTC competition.
This means you cannot rely on average creative. Your content production, performance creative, and landing page experience must work harder.
At the same time, verticals like Apparel and Lifestyle usually benefit from stronger brand identity and social-first creative formats, which can sustain higher CTR in dense urban markets.
The takeaway is simple: do not compare your brand to a platform average alone. Compare yourself to your industry first. Then adjust expectations based on NYC auction pressure.
Paid Social Benchmarks by Funnel Stage for E-commerce Brands
Note that not all performance metrics carry the same weight across your funnel. What looks strong at the awareness stage may look weak at the conversion stage. So, if you judge every campaign by ROAS alone, you will misread performance signals.
Let’s explore how benchmarks shift as you move from the top to the bottom of the funnel.
1. Awareness Stage
At the top of the funnel, your primary goal is reach and qualified attention. CPM becomes your main KPI because you are buying visibility.
Here we suggest monitoring:
- CPM
- Reach
- Frequency
- Video view rates for video content
At this stage, a higher CPM can be acceptable if you are targeting high-intent or premium audiences. The focus is on scale and controlled exposure, instead of immediate conversion.
In New York City, awareness CPM typically exceeds the national median due to advertiser density. That does not automatically signal inefficiency. It simply reflects competitive auction dynamics.
2. Consideration Stage
Once you move into mid-funnel campaigns, engagement becomes more important than raw reach. CTR and interaction rates tell you whether your ad creative and audience segmentation are working.
You should monitor:
- CTR
- Engagement rate
- Cost per landing page view
- Audience drop-off behavior
This is where performance creative, UGC ads, and content production quality start separating strong campaigns from average ones. If CTR remains below the benchmark at this stage, scaling spend will not fix the issue.
In NYC, creative fatigue accelerates at a higher rate, which means your creative testing cadence must move faster to maintain stable engagement performance.
And this is where most in-house teams hit a ceiling.
Producing high-volume creative consistently, while managing media buying, audience insights, and performance data, stretches internal teams thin. Creative slows down, testing stalls, and performance plateaus.
In such cases, working with an experienced paid social media agency like inBeat Agency can be really helpful.
For example, when we partnered with a NYC-based brand, Prose, we built a scalable micro-influencer recruitment system designed to sustain creative velocity. We activated more than 20 micro-influencers per campaign and delivered 100+ creative assets each month for paid campaigns.
That level of content production supported faster testing cycles and stronger performance signals. As a result, the program drove a 45% year-over-year increase in ROAS and reduced overall customer acquisition cost by 20%.

3. Conversion Stage
At the bottom of the funnel, efficiency takes priority. CPC, conversion rate, and ROAS dominate decision-making because now you are measuring real revenue impact.
At this stage, you should monitor:
- CPC
- Conversion rate
- ROAS
- Customer acquisition cost
- Customer lifetime value
This is where conversion tracking accuracy, landing page experience, and retargeting strategy matter most. If your CPC is healthy but the conversion rate drops, the issue likely sits on your landing page or within your funnel.
In high-cost markets like New York City, small improvements in conversion rate can dramatically improve overall business outcomes because your baseline media costs are already elevated.
Remember that each stage has a different job, and your benchmarks should reflect that role. This is why our team at inBeat Agency always evaluates performance metrics based on funnel intent.
Scale your Paid Social Performance with inBeat Agency
If you are looking to improve creative velocity, tighten performance signals, and build scalable acquisition systems, inBeat Agency can help. We combine structured creative testing, UGC production, and data-backed campaign execution to support measurable growth.
Book a free strategy call to explore how your paid social can perform more efficiently.
FAQs
What is a good CTR for paid social?
A healthy paid social CTR typically sits around 1.1% to 1.3%. That places you near national averages and signals that your ad creative and audience segmentation are aligned. If you consistently reach 2% or higher, your messaging and offer are likely resonating strongly. If CTR falls below 0.6%, you may need to revisit your creative, targeting, or content strategy.
Should I focus on Meta, TikTok, or both for paid social?
It depends on your funnel and creative capabilities. Meta usually delivers stronger retargeting and bottom-funnel efficiency. TikTok performs well for discovery and creative testing. Many e-commerce brands use both platforms strategically by aligning each with specific funnel stages and campaign objectives.
How do benchmarks change during peak NYC shopping seasons?
During Q4 and major retail periods, CPM and CPC typically increase due to heavier advertiser competition. CTR may fluctuate depending on creative freshness. Conversion rates can improve if purchase intent rises, but only if your landing pages and campaign structures are optimized for high traffic volume.
How does inBeat Agency structure paid social campaigns for e-commerce brands?
We structure paid social campaigns around funnel intent and performance signals. Our approach aligns prospecting, retargeting, and conversion campaigns into one system. We build campaign structures that allow faster creative testing, cleaner data insights, and measurable progression.
Does inBeat Agency handle both creative production and media buying?
Yes, we handle both. Our team manages high-volume content production, including UGC ads and video content, while also overseeing media buying across Meta, TikTok, and other social channels. This alignment ensures our ad creative evolves based on live performance data.
How does inBeat Agency approach audience segmentation in competitive NYC markets?
In high-density markets like New York City, we focus on layered audience segmentation. We test interest stacks, lookalikes, and pixel-based retargeting while monitoring performance metrics closely. Our goal is to find efficient pockets of qualified attention instead of competing broadly.
Appendix
- https://www.emarketer.com/content/us-social-network-ad-spending-forecast-report-h2-2025
- https://lebesgue.io/tiktok-ads/tiktok-ads-benchmarks-for-ctr-cr-and-cpm
- https://www.webfx.com/blog/social-media/meta-benchmarks/
- https://searchengineland.com/tools/benchmark-tools/paid-social-ctr-benchmarks
- https://mynameisbond.co/en/blog/instagram-conversion-rate-complete-guide-optimise-results
- https://www.trendtrack.io/blog-post/what-is-a-good-roas-for-ecommerce
- https://www.triplewhale.com/blog/ecommerce-benchmarks
- https://www.smartinsights.com/internet-advertising/internet-advertising-analytics/display-advertising-clickthrough-rates/