


.svg)
.svg)
.svg)
.svg)

.svg)


Do you find yourself investing heavily in growth, yet reporting usually feels blurry? Well, that blur can create a lot of risk for your organization. Studies estimate up to 26% of marketing budgets are wasted due to poor tracking and attribution gaps.
So when your agency sends polished slides but cannot reconcile revenue with spend, you feel the “black box” problem. High retainers demand financial clarity that can drive action. They don't want surface-level marketing agency reporting.
In this article, we’ll share what disciplined reporting actually requires and compare it against your current setup. This will help you identify where marketing measurement breaks down and what needs to change to regain financial visibility.
P.S. If your reporting still feels like a black box, inBeat Agency builds structured marketing reporting that ties spend directly to revenue. Book a strategy call with us if you want full-service influencer and paid media reporting built around financial clarity.
TL;DR
- Marketing agency reporting should translate execution into financial accountability.
- Vanity metrics erode credibility, so focus on CAC, LTV, MER, and revenue contribution instead.
- Strong reporting answers three questions: What changed, why it changed, and what action follows.
- Use tiered reporting: daily dashboards, weekly sprint reviews, monthly strategy reports, and quarterly business reviews.
- Creative performance must be tracked through hook rate, hold rate, and structured feedback loops.
- Demand transparency, defined attribution models, and CRM integration to connect spend to revenue.
What Is Marketing Agency Reporting (And What It Isn’t)
Marketing agency reporting is the structured translation of execution into financial accountability. It connects spend, channel activity, and performance metrics to revenue impact and capital allocation decisions.
But raw dashboards or exported campaign data are not reporting. Those are inputs.
Strategic reporting interprets movement, explains causality, and outlines next actions. If it doesn't, it will keep your company running in one place.
But did you know that nearly 45% of marketing data is inaccurate, incomplete, or outdated? That weakens reporting unless numbers are validated and reconciled first.
So reporting must bridge marketing execution with board-level financial goals.
Here's why this is so important:
With that foundation clear, this leads us to examine why so many reports still fail.
Why Most Marketing Agency Reports Fail
You expect reporting to connect marketing execution with revenue impact. Yet many reports stop at surface activity. That disconnect between clicks and board-level outcomes is where failure begins.
From what we have seen, a few common patterns cause this gap.
Vanity Metrics vs. Business Metrics
At first, you may see impressions, CTR, or engagement shown in report summaries. But your board evaluates CAC, LTV, and pipeline velocity. When attention metrics replace financial indicators, credibility erodes.
In fact, 65% of CEOs do not trust their CMOs to deliver business outcomes, which reflects a reporting gap between activity and results.
This is where many teams mess up. Reports highlight impressions, clicks, and engagement rates, while leadership wants visibility into acquisition costs, lifetime value, and revenue impact.
Instead, your reporting should clearly track metrics such as cost per acquisition, customer lifetime value, revenue contribution, and other related metrics.
The Problem with the “Data Dump” Approach
Massive exports from Google Analytics or shared Excel spreadsheets are not a strategy. Without context, numbers lack meaning. But, effective reporting answers three questions:
- What changed?
- Why did it change?
- What action follows?
Pro tip: From our daily experience, we advise you to require written explanations of performance shifts so all metrics are tied to specific causes and clear decisions.
Moving on, let’s define the standards you should require from your agency.
Expectations You Should Have of Marketing Agency Reports
Reporting must operate as a governance layer rather than as a courtesy update. After all, you do allocate capital under scrutiny, right?
Because of that, these are the non-negotiables you should require from any partner from now on.
1. Total Transparency and Data Ownership
First, you should own the ad accounts, pixels, and historical performance data. Access should sit within your business and not with your agency.
When platforms are white-labeled or routed through proprietary agency reporting software, visibility into actual spend or margin allocation narrows.
And that limits auditability.
In our experience, teams avoid many reporting conflicts simply by securing direct ownership of their marketing infrastructure from the start.
In fact, 44% of consumers say transparency about data usage is the number one driver of trust in a company. This expectation extends internally as well, where leadership confidence depends on full visibility into how marketing capital is deployed.
Clear ownership protects financial control and prevents reporting disputes during board reviews.
2. Real-Time Access vs. Monthly Retrospectives
Second, you need continuous visibility. Live dashboards in Looker Studio or Power Bi allow daily validation of spend and volume, while monthly reviews focus on strategic shifts.
Remember: 67% of users lose confidence when dashboards show stale data. So access to current numbers supports timely budget adjustments and risk containment.
3. Clear Attribution and ROI Modeling
Third, attribution logic must be defined upfront to prevent reporting disputes later. Whether you use first-click, last-click, or data-driven models, agreement early creates shared expectations around performance evaluation. Without that alignment, results typically get reinterpreted after spend occurs.
Also, we recommend tracking ROAS (Return on Ad Spend) and POAS (Profit on Ad Spend) to connect marketing activity directly to revenue and profit impact.
Next, let’s define the specific metrics your reports must include.
KPIs Marketing Agency Reports Must Include
You do not need more dashboards, but you do need the right marketing agency metrics, organized by decision layer. Without a tiered structure, reporting turns into disconnected metrics that do not support decisions.
So here are the tiers your client reporting should follow if you want defensible capital allocation.
Financial & Efficiency Metrics
These metrics determine whether spend creates sustainable growth and whether budgets can scale:
- CAC (Customer Acquisition Cost): Measures how much you spend to acquire one customer across channels. The average B2B customer acquisition cost is about $536 per customer, which gives leadership a baseline for evaluating efficiency across traffic sources.
- LTV:CAC Ratio: Compares lifetime customer value to acquisition cost. Healthy businesses aim for at least a 3:1 ratio. This means the lifetime value should be three times acquisition cost to maintain profitable growth.
- MER (Marketing Efficiency Ratio): Evaluates total revenue generated relative to total marketing spend. A MER between 3.0 and 5.0 is typically considered healthy, which indicates balanced scaling without overspending.
These metrics matter because executives defend budgets using financial efficiency. So, clear reporting here connects spend to revenue outcomes.
Funnel Performance Metrics
Funnel metrics explain where performance improves or breaks inside the buyer journey. They are:
- Conversion Rate (CVR): Shows how efficiently visitors become customers. Global ecommerce conversion rates average around 2.5%-3.0% and provide context for evaluating campaign effectiveness.
- Cost Per Lead (CPL): Measures acquisition efficiency before revenue occurs. According to 2026 Google Ads benchmarks, average CPL sits near $70.11.
- Cart abandonment rate: Indicates friction before purchase completion. The global average abandonment rate is roughly 70.19%, which signals optimization opportunities in checkout or messaging.
Together, these metrics isolate leaks so teams can focus optimization efforts precisely.
Pro tip: If you want to improve performance beyond reporting, check out our conversion rate optimization agency recommendations to see who can help turn insights into revenue growth.
Channel-Specific Operational Metrics
Operational indicators assess channel health rather than success outcomes. Hence, we believe you should monitor CPM fluctuations, frequency saturation, and impression share across social media platforms and paid channels.
These are diagnostic signals used during performance interpretation. They can help explain changes in campaign performance rather than proving business impact.
5 Types of Marketing Agency Reports for Decision Making
Different reports serve different stakeholders. Media buyers need daily operational visibility, VPs require trend analysis, and CEOs focus on financial outcomes and risk exposure.
Reporting frequency must match decision speed. So, fast-moving execution relies on frequent updates while strategic oversight depends on structured client reports supported by consistent automated reporting systems.
Below, we have shared the report types that align execution with oversight and capital allocation discipline.
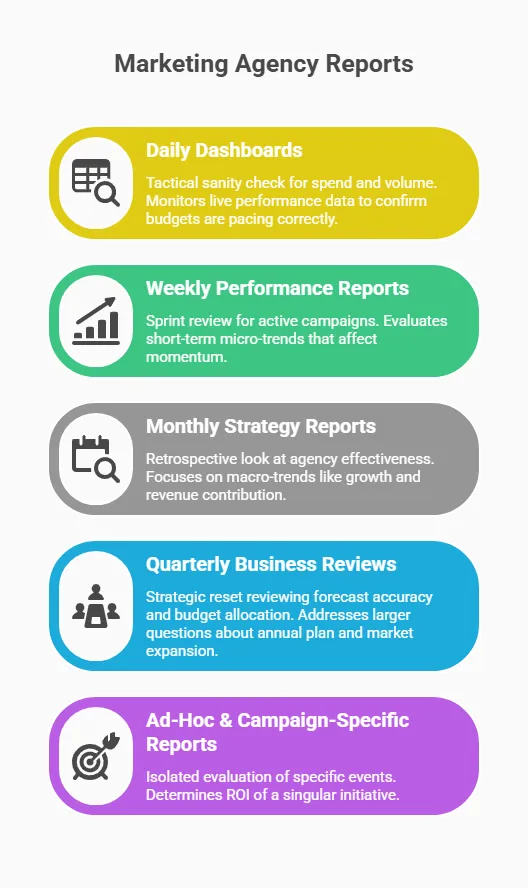
1. Daily Dashboards
Daily dashboards function as a tactical “sanity check” for spend and volume. They monitor live performance data across active paid advertising campaigns to confirm budgets are pacing correctly and tracking remains intact.
Their primary purpose is anomaly detection. If ad spend spikes unexpectedly, conversion tracking breaks, or volume drops sharply, you identify it within hours rather than weeks. This prevents small errors from compounding into wasted budget.
This report primarily serves the Marketing Manager or media buyer (not the CEO). It supports execution oversight rather than strategic evaluation. And because 81% of teams collect and analyze data, the risk is not a lack of data collection but failing to monitor it at the right cadence.
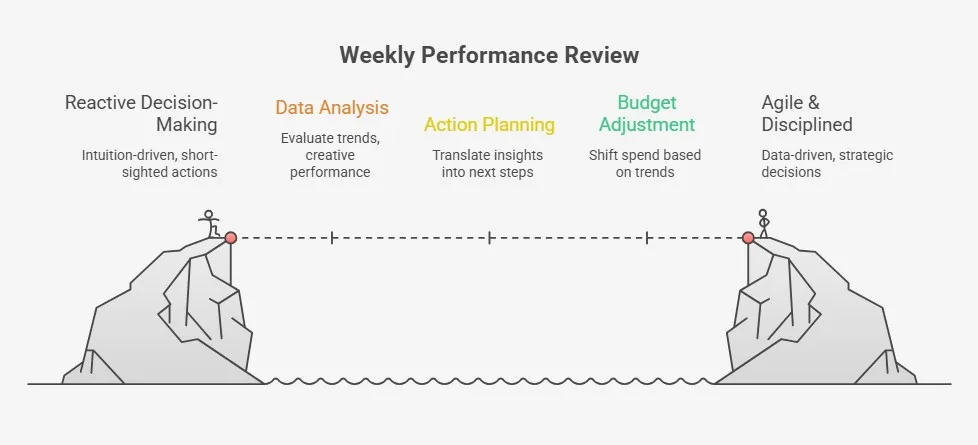
2. Weekly Performance Reports
The weekly report operates as the sprint review for active campaigns. It evaluates short-term micro-trends that affect momentum.
You review questions such as:
- Which creative is gaining traction?
- Which audience segment shows fatigue?
- Where are conversion rates shifting?
This review uses structured data sources pulled from your reporting platform to analyze creative rotation, spend distribution, and efficiency signals. It translates recent performance into the next 7-day action plan. Budgets shift, creatives rotate, and targeting adjusts based on observable trends rather than intuition.
In our daily practice, we have noticed that teams improve campaign stability when they commit to this weekly rhythm. It creates enough agility for optimization while keeping decisions grounded in actual performance signals.
3. Monthly Strategy Reports
The monthly report looks back retrospectively and grades the agency’s overall effectiveness. It focuses on macro-trends such as Month-over-Month growth, CAC stability, pipeline quality, and revenue contribution tracked through CRM systems.
Unlike daily or weekly views, this report aggregates performance across channels and evaluates structural patterns.
Leadership typically reviews questions such as:
- Are acquisition costs stable?
- Is pipeline quality improving?
- Are campaigns contributing predictable revenue?
This is the report a VP takes to internal leadership meetings. It connects marketing performance to business health and establishes accountability beyond channel metrics.
4. Quarterly Business Reviews (QBR)
A QBR is not simply an extended monthly report. It is a strategic reset because it reviews forecast accuracy, budget allocation efficiency, and expansion opportunities for the next quarter.
This review evaluates whether your marketing reporting software integrates clean data sources and whether allocation aligns with growth targets.
It addresses larger questions:
- Are we still on track for the annual plan?
- Do budget shifts need recalibration?
- Should new markets or segments be tested?
The QBR answers the fundamental question: Are we still on the right path for the year?
Watch this short video to learn the QBR best practices:
5. Ad-Hoc & Campaign-Specific Reports
Certain events require isolated evaluation. Black Friday promotions, product launches, or major social media marketing pushes need custom reports that separate their impact from baseline activity.
These reports isolate specific variables to determine the ROI of a singular initiative. They clarify whether incremental revenue justifies incremental spend and prevent blended reporting from masking underperformance.
Why Creative Marketing Agency Reporting Is Important
Creative is no longer a soft variable. In a post-iOS14 environment where targeting signals weakened, performance depends more on asset quality and audience response than on algorithmic precision.
This shift makes creative analysis central to your reporting process, which means it's not an afterthought inside your marketing reporting tools.
Tracks Creative Fatigue and Lifespan
Creative assets decline over time. You can track this by monitoring performance data for decay in engagement, rising acquisition costs, and reduced conversion efficiency.
Hook rate (3-second stop rate) measures whether the first seconds capture attention. Hold rate measures whether viewers stay through the core message.
According to Motion, average hold rates sit around 40-50%. Over 60% is considered strong, while under a 30% hook rate suggests the ad needs work. These thresholds allow you to retire assets before they damage efficiency.
This is where specialist expertise matters.
Agencies like inBeat Agency help you monitor creative cadence and fatigue across UGC and influencer content. We do this by combining performance creative insights with creator-sourced assets.
For example, Native produced over 1,000 unique photo and video assets through micro-creator engagements. This enabled continuous A/B testing and rapid replacement of underperforming content.
Here's an example of our work together:
Improves Creative Performance Through Feedback Loops
Based on our experience, we believe that creative reporting should inform your next batch of content. A disciplined reporting process separates clear winners from losers through structured A/B testing results.
You should do this because 70% of performance marketers are actively testing new ad formats since many creatives show diminishing returns over time. This behavior reflects a structured feedback loop where data guides iteration instead of intuition.
Tools That Power Modern Marketing Agency Reporting
Modern reporting depends on an integrated software ecosystem. No single dashboard can deliver full visibility. Instead, agencies rely on layered tools that centralize data, validate attribution, and connect marketing activity to revenue.
These are the core systems that structure disciplined reporting.
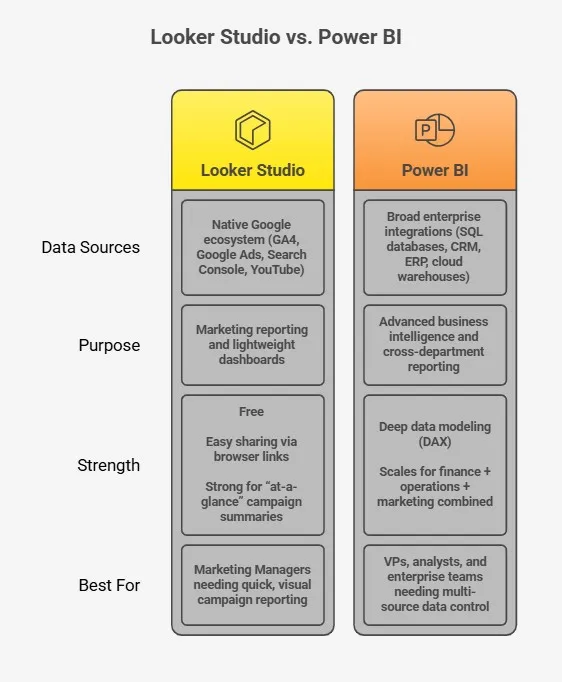
Looker Studio and Power BI for Centralizing Data
Data visualization platforms like Google Data Studio (Looker Studio) and Power BI serve as aggregation layers. They pull campaign performance from Google Ads, Meta, LinkedIn, and other channels into a single business intelligence environment using structured API connectors.
Their value lies in clarity.
Instead of dealing multiple ad managers, executives see consolidated “at a glance” summaries that show spend, revenue, and efficiency metrics in one view. These executive dashboards reduce interpretation friction during board reviews.
Automation strengthens this layer. In fact, HubSpot reports that automation tools are used by 92% of marketers for data analysis and reporting. This adoption reflects the need for reliable, recurring visibility without manual spreadsheet consolidation.
Advanced Attribution Tools
In-platform reporting has structural bias. Platforms typically credit conversions to themselves, which can inflate performance perception. Without cross-channel reconciliation, spend allocation decisions rely on partial visibility.
Third-party attribution tools such as Triple Whale, Northbeam, and Google Analytics 4 function as an independent source of truth. They evaluate customer journeys across channels rather than within one ad network.
And because 57% of companies have used some form of marketing attribution model in 2025, structured attribution is now standard rather than optional.
These tools prevent over-reporting distortions and strengthen budget allocation decisions.
Integrating CRM Data for Full-Funnel Visibility
True reporting closes the loop between lead and revenue. Connecting HubSpot or Salesforce through structured integrations ensures marketing outcomes reflect pipeline and closed-won revenue inside CRM systems.
Offline Conversion Tracking (OCT) extends visibility further by linking sales outcomes back to campaigns. This integration transforms campaign metrics into verified revenue signals and eliminates reporting gaps between marketing and sales.
Signs of Poor Marketing Agency Reporting
Poor reporting rarely fails loudly. It usually erodes confidence slowly through inconsistency, missing context, and unclear accountability. Reporting quality directly affects agency retention.
In fact, 75% of marketers have fired agencies because of poor reporting, and 40% already plan to switch partners soon.
Let’s explore the warning signs you should watch for when evaluating agency reporting.
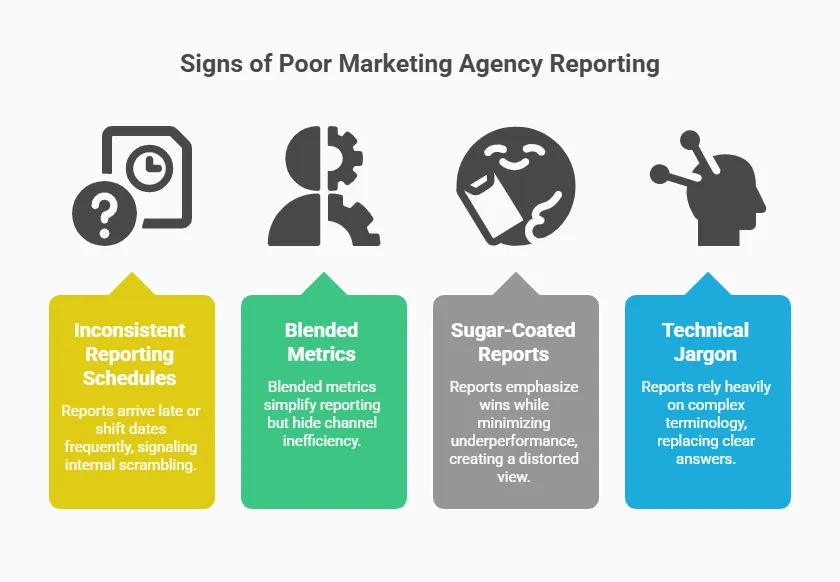
1. Inconsistent Reporting Schedules
Reliable reporting follows a predictable cadence. When reports arrive late or shift dates frequently, it usually signals internal scrambling.
In our experience, delays usually appear when teams are still reconciling numbers, fixing tracking issues, or rebuilding dashboards shortly before delivery.
Consistent timing shows operational discipline, while delays suggest weak reporting processes rather than complex analysis.
2. Blended Metrics That Mask Channel Inefficiency
Blended metrics can simplify reporting, but they can also hide problems. When blended CAC is presented as the primary performance indicator, inefficient channels disappear inside averages. One campaign may perform well while another burns budget, yet the combined number looks acceptable.
Effective reporting separates channel-level efficiency. This way, you can see where capital actually produces returns instead of relying on aggregated summaries generated through marketing reporting software.
3. Sugar-Coated Reports
Some reports emphasize wins while minimizing underperformance. You might see strong creative examples, rising impressions, or isolated success stories without clear reference to missed targets or declining efficiency. This creates a distorted view of reality.
Pro tip: We advise you to demand honest failure analysis because understanding why performance declined creates more value than celebrating incomplete success narratives.
4. Technical Jargon Used to Confuse
Another warning sign appears when reports rely heavily on complex terminology. Long lists of acronyms or overly technical explanations can replace clear answers.
Reporting should translate performance into business outcomes. It shouldn't require interpretation through dense language or exported Google Sheets filled with unexplained metrics.
Research also shows a trust gap in reporting expectations.
According to MarketingWeek, around 41% of analysts identify inconsistent or inaccurate data as a major barrier to trust, yet only about 30% of marketers recognize the issue.
This mismatch usually leads leadership to question reporting reliability even when marketing teams believe everything is functioning normally.
Best Practices For Structuring Your Monthly Review Call
Move beyond reviewing reports and use the meeting to drive decisions, priorities, and accountability tied to future performance. Here's what you need to do:
- Shift the conversation from explaining past results to defining next actions tied to key performance indicators and growth priorities.
- Start with a clear agenda: performance summary (5 minutes), decision discussion (15 minutes), next experiments and ownership (10 minutes).
- Treat the meeting as forward planning by focusing on what changes next month.
- Ask direct questions that force clarity and hypotheses:
- Why did CPM spike this month?
- Which audience insights changed our assumptions?
- What underperformed, and what action follows?
- What is our hypothesis for next month’s creative test?
- Which experiment will meaningfully change results?
- End every review with documented decisions, owners, and measurable next steps.
- Using an AI note taking tools during these calls ensures action items and decisions are captured automatically, so nothing gets lost between the meeting and execution.
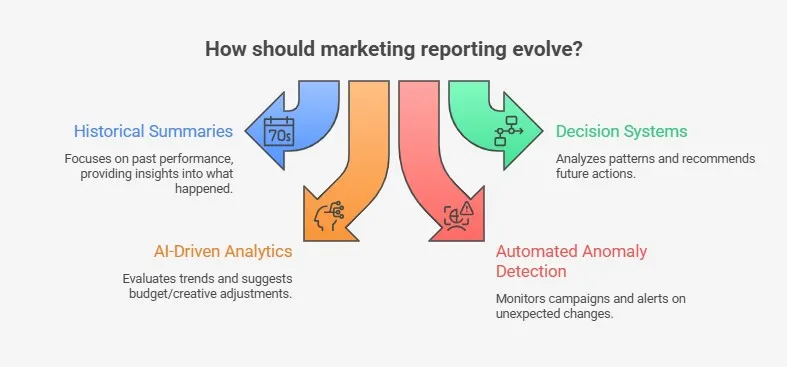
What Marketing Agency Reporting Looks Like in the Future
Marketing agency reporting is shifting from historical summaries toward decision systems that actively guide execution. Instead of asking only what happened last month, modern reporting analyzes patterns and recommends what should change next.
AI-driven analytics now evaluate performance trends, compare scenarios, and suggest budget reallocations, creative adjustments, or targeting changes based on observed outcomes. This transition moves reporting from descriptive analysis into prescriptive decision support.
In our daily practice, we have noticed that teams respond faster when reporting tools highlight performance signals automatically. The focus shifts from manual investigation toward quicker operational decisions.
At the same time, automated anomaly detection is becoming a core safeguard. Advanced platforms monitor campaign activity continuously and trigger alerts when spend spikes, conversion rates drop, or tracking behavior changes unexpectedly.
These safety guardrails allow you to react immediately rather than discovering problems weeks later in monthly reviews. Future reporting systems will increasingly function as operational monitors that protect campaign performance before financial losses accumulate.
Get Transparent, ROI-Focused Reporting with inBeat Agency
Disciplined marketing agency reporting connects execution to financial accountability. As outlined throughout this guide, strong reporting requires clear attribution, structured KPIs, creative performance analysis, and defined next steps that protect capital allocation.
inBeat Agency treats your budget with the same scrutiny it applies to its own. Our team focuses on transparent attribution, performance-driven UGC, and measurable bottom-line growth.
If you want clarity over assumptions, audit your current reporting strategy with our team and evaluate where your reporting may be limiting growth.
FAQs
What should be included in a marketing agency report?
A strong report includes an executive summary, clearly defined KPIs, and performance analysis tied to business outcomes. It should also outline the next steps so leadership understands what actions follow the data.
How often should a marketing agency provide reports?
Live dashboards should update daily to monitor spend, pacing, and anomalies in real time. Strategy-focused reporting should occur monthly to evaluate trends, decisions, and budget direction.
How do you report on UGC and Creative Performance specifically?
Creative reporting tracks hook rate, hold rate, and click-through rate for each video asset to measure attention and conversion behavior. This data helps agencies like inBeat refine creator briefs and production direction to maximize ROAS.
What is the difference between ROAS and MER in reporting?
ROAS measures the return generated from a specific advertising platform or campaign. MER, in contrast, evaluates total revenue against total marketing spend, which gives a holistic view of business efficiency.
Can I see performance data for my TikTok campaigns in real time?
Yes, modern agencies use custom dashboards that pull live API data directly from TikTok Ads Manager. This transparency allows rapid budget shifts toward trending content, which is central to inBeat’s TikTok marketing approach.
How does inBeat Agency improve marketing reporting accuracy?
inBeat Agency connects creator performance, paid media results, and attribution tracking into unified dashboards. This structure reduces reporting gaps and links creative performance directly to revenue outcomes.
How does inBeat Agency use reporting to improve future campaigns?
We analyze performance patterns across creators and creatives to guide the next production cycle. These insights help us prioritize testing, refine creator selection, and make more confident scaling decisions.