


.svg)
.svg)
.svg)
.svg)

.svg)


Keeping a customer costs five to seven times less than acquiring a new one.
From our perspective, that stat is virtually impossible to ignore.
The problem is that, in our experience, many marketers still make retention decisions on instinct. That’s without benchmarks that actually match their business model.
This article helps you change that.
You'll find 90 verified statistics, metric definitions, industry benchmarks, and clear takeaways. And yes, we’ve organized them all so you can move from data to decision faster.
Let’s dive in.
TL;DR
- Retention benchmarks range from 30% in transactional ecommerce to 90%+ in B2B subscriptions.
- A 5% retention improvement can lift profits by 25-95%.
- Existing customers convert at 3-10x the rate of new prospects.
- Price is the assumed churn culprit. Poor experience and weak onboarding are the actual drivers in most documented cases.
- Involuntary churn (i.e., billing failures) is a separate, largely recoverable problem that most teams are, unfortunately, not treating separately.
- Proactive outreach, omnichannel coordination, tiered loyalty, and behavioral email automation have the strongest evidence behind them.
How to use this page:
- Match the benchmark to your business model before drawing any conclusions.
- Compare against your category's top quartile and don’t rely too much on the all-industry average.
- Pick one underperforming metric, find the tactic with the strongest evidence for that specific gap, and test it in isolation first.
What Is Customer Retention, and How Is It Measured?
Customer retention is easy to define and, paradoxically, also easy to measure badly.
The right mix of metrics depends on your specific business model. Using the wrong one produces targets that look healthy while real problems go undetected.
Core metrics include:
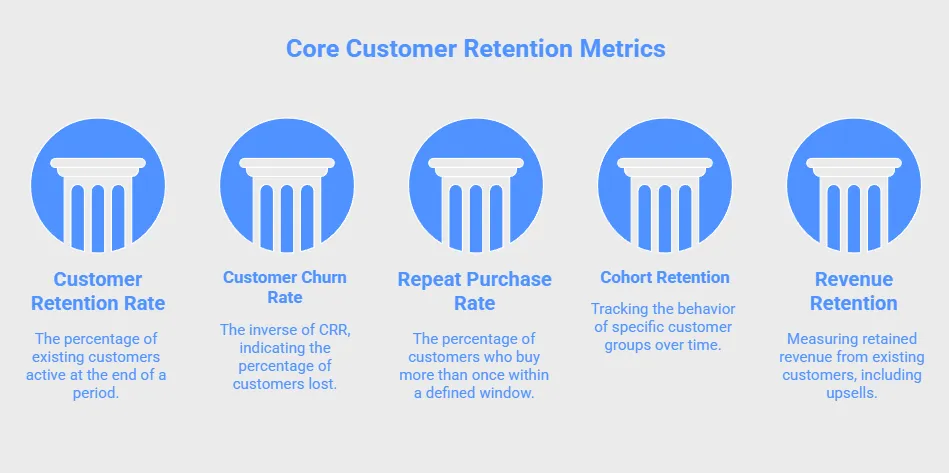
- Customer Retention Rate (CRR): This is the percentage of your existing customers that are still active at the end of a certain period. Most businesses measure CRR per year, though subscription businesses usually track monthly CRRs.
- Customer Churn Rate (CCR): This is the inverse of CRR, so a 15% annual churn rate means 85% retention. The problem is that a 5% monthly churn rate compounds to roughly 46% annual churn. So, take our advice and always convert to annual figures for a clearer picture.
- Repeat Purchase Rate (RPR): This is the percentage of customers who buy more than once within a defined window. In most cases, that’s typically 12 months. This is the most practical metric for transactional ecommerce because you’ll have no formal subscription relationship here.
- Cohort Retention (CR): This metric looks at how a specific group of customers (defined by acquisition date, channel, or product) behaves over time. This is genuinely rigorous because you’re not dealing with fake signals coming from mixing old and new customers in a single combined figure.
- Gross Revenue Retention (GRR) and Net Revenue Retention (NRR): These metrics are mostly used in SaaS and subscription businesses. Or at least that’s what we recommend. GRR measures retained revenue from existing customers, excluding expansion; NRR includes upsells and expansion. An NRR above 100% means that your existing customer base grows revenue even with zero new acquisitions!
Customer Retention Statistics
Now that we understand what customer retention is and how to measure it, let’s look at the most important current benchmarks.
Customer Retention Benchmarks and Averages
We love retention benchmarks as much as any advertising agency, but here’s the truth:
They’re only useful when you match them to the right business model; that’s your business model. So, we picked the figures below to establish baselines across the major model types: transactional ecommerce, subscription, SaaS, and mobile.
That way, you get a few reference points that are actually comparable to your own situation.
1. According to Blogging Wizard, which cites Statista, the average customer retention rate across all industries is approximately 75%.
2. Mailmodo claims that an ideal retention rate is generally considered 90% or higher. Ideally, that means 90 out of 100 customers continue doing business with you over a given period.
3. The average ecommerce customer retention rate is approximately 30% based on data from Shopify. This figure shows intense online competition (but that’s nothing new), as well as low switching costs between online stores.
4. Subscription ecommerce businesses average a 67% retention rate, if you’re to trust Marketing LTB (and we do). Plus, if you compare this figure with the one above, you can see it significantly outperforms standard ecommerce models.
5. The average ecommerce repeat purchase rate is 28.2%, according to Opensend. In other words, less than one in three customers returns within a 12-month window.
6. Opensend also highlights that a healthy repeat purchase rate for most online stores falls between 20% and 40%. Of course, take this with a grain of salt. In our experience, there’s a wide variation by product category and purchase cycle.
7. BS&Co has an interesting piece of data: across 156,110 DTC customers tracked over 365 days, only 18.8% placed a second order. And of those who did, 50.3% did so within the first 30 days.
8. Speaking of customers who do make a second purchase, BS&Co says that 77% of them prefer to reorder the same product instead of cross-buying into a new category. Basically, your competitors have zero chance if people have already picked your product once. And sadly, the reverse of the medal is equally true.
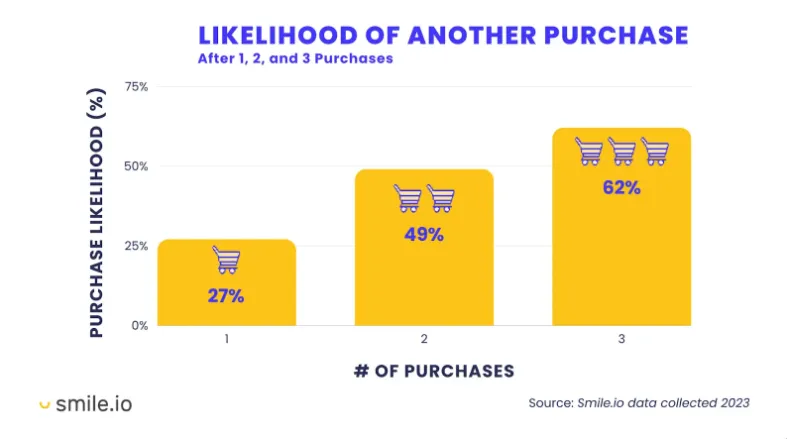
9. Smile.io discusses subsequent purchases, too. Well, they say that after a first purchase, a customer has a 27% chance of buying again. After a second purchase, that rises to 49%. After a third, it climbs to 62%.
10. The average B2B SaaS annual retention rate is 74%, according to Serpsculpt. However, look at what top performers are doing: they’re pushing net revenue retention (NRR) above 120%.
11. According to Marketing LTB, high-performing SaaS companies keep annual churn under 3%. That’s almost twice as little as the average SaaS annual churn, which ranges from 5% to 8%.
12. Marketing LTB also notes that SaaS companies with usage-based pricing models have 15–30% lower churn than those on fixed subscription models. So, you might want to consider switching your model to increase your customer retention.
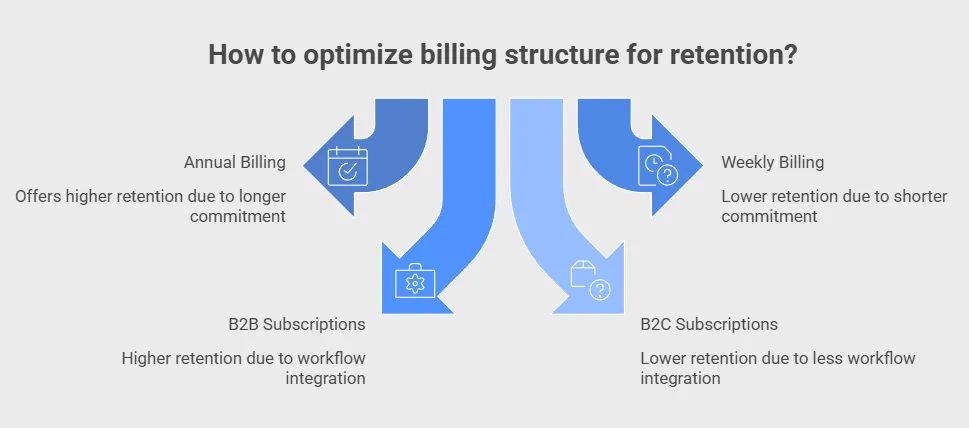
13. Focus Digital shows that B2B subscription businesses maintain an average retention rate of 90%. By comparison, that rate is lower (72%) for B2C subscription businesses. This gap can easily be explained through longer evaluation cycles, multi-stakeholder decisions, and deeper product integration.
14. For subscription businesses, voluntary churn hovers around 7% per month, though involuntary churn is much lower, averaging approximately 1%. However, overall churn is near 10%, according to the Churnkey State of Retention 2025.
15. According to the same report cited above, a monthly churn rate of just 5% means you’ll be losing nearly 46% of customers annually. In other words, a monthly churn above 10% effectively means replacing the entire customer base within a year.
16. Envive says that annual billing cycles maintain a 28% one-year retention rate. However, that’s just 3% for weekly billing, so we can easily notice a 9x difference driven entirely by billing frequency.
17. The Blogging Wizard claims that the average 30-day mobile app retention rate across all industries is 5.7%.
18. The Blogging Wizard also gives us the winner in this mobile app category: it’s banking apps! They have the highest 30-day retention at 13.4%. That’s three times as much as casual gaming apps, which average just 4.5% at the same mark.
19. 44% of businesses still do not calculate their customer retention rate at all, according to Mailmodo.
20. And that’s a loss for them because companies that focus on retention over acquisition are estimated to be 60% more profitable, also according to Mailmodo. But for that, you first need to understand where you currently stand.
Takeaway
From our perspective, the single most underappreciated insight buried in these benchmarks is the compounding relationship between billing structure and retention.
The 9x retention gap between annual and weekly billing cycles, and the structural advantage B2B subscriptions hold over B2C, both point to the same underlying dynamic: the more deeply a product is embedded into a customer's workflow or habit stack, the stickier it becomes.
That’s why we advise you to have the retention conversation very early: in pricing, packaging, and product design. As you can see, that’s long before any lifecycle email or loyalty program can compensate for a fundamentally low-friction product.
Customer Retention by Industry and Segment
Industry-level benchmarks answer a question that cross-sector averages can't: is your retention rate a competitive liability, or is it simply just the maximum you can achieve in your vertical?
Context is everything, so we picked the most relevant numbers across 14 niches.
21. According to the Shopify article above, media companies have the highest average customer retention rate at 84%. This impressive number is likely driven by subscription models and content-driven engagement.
22. Professional services (consulting, legal, accounting) average 84% retention, too, according to Blogging Wizard. From our experience, high-touch relationships and recurring project work are the biggest contributors, though not all niches have this kind of advantage.
23. Insurance businesses maintain an average retention rate of 83–84% as well, says Mailmodo. In most cases, that’s because switching between providers is not easy or pleasant.
24. Banking and financial services average 75% retention, says the Blogging Wizard. There’s a silver lining, though: up to 50% of customers who leave a bank do so within the first 90 days of opening their account.
25. If you’re in banking, that doesn’t mean you’re off the hook. In fact, 80% of banking customers say they would switch if a rival offered a better experience, and 56% who have already left say their bank made no effort to retain them. This is also according to the Blogging Wizard.
26. Tridens brings us to the high-churn niches. Telecom churn rates can be as low as 20%, but as high as 50% annually. It’s basically one of the highest-churn industries, and that’s despite infrastructure switching costs.
27. Mailmodo notices that retail businesses average a 63% customer retention rate, which is also pretty low. High competition and ease of exit are usually the main culprits of this low customer loyalty.
28. U.S. hospitality, travel, and restaurant companies average 45% annual churn, as per data from Qualtrics. If you’ve been paying attention, that’s among the highest of any major sector.
29. Online retail has an average annual churn rate of 22%, following data from the Blogging Wizard.
30. The same source suggests that cable and financial/credit companies see churn as high as 25%.
31. Serpsculpt shows that IT services and consulting firms lead B2B verticals in raw retention, with rates as high as 83 to 85%.
32. Transactional ecommerce isn’t that lucky, though. According to Focus Digital, you’re likely to average just 38% retention if you’re in this niche. That’s possibly caused by low switching barriers and intense price competition. That’s pretty similar to what happens to retail businesses.
33. According to Shopify, the CBD industry leads ecommerce repeat purchase rates at 36.2%. High-performance sports brands average 33%, consumables like meal delivery and supplements hover around 29%, and apparel averages 20–26%.
34. MobiLoud shows that supplement brands have repurchase rates of 37.7%. From our internal data, subscription and auto-ship adoption are the likeliest drivers of this number.
35. Luxury goods see only 9.9% repeat purchase rates, though, according to the previous Envive article we cited.
36. However, those customers are pretty valuable. They show 73% brand advocacy rates and generate 4.2x higher referral values than the average buyer, as per Envive.
37. Envive also shows that electronics face a structural 18% retention due to long replacement cycles. Still, accessory sales to existing customers generate 37% of revenue in the category.
38. Social media platforms average over 90% churn over 24 months, according to Qualtrics. But some platforms drag this average higher than others. Twitter, for example, has the highest two-year churn at 77%. By comparison, Facebook’s customer churn is approximately 30%.
39. Repeat customers make up 48% of all ecommerce transactions despite being a minority of total customers, according to Opensend.
40. MobiLoud shows that brands with mobile apps see up to 50% higher repeat purchase rates compared to mobile web alone. Even more interestingly, app users purchase approximately 33% more frequently than non-app users. And yes, that means it’s time to finally create that app.
Takeaway
The most strategically useful pattern across these figures is what drives the outliers at both ends.
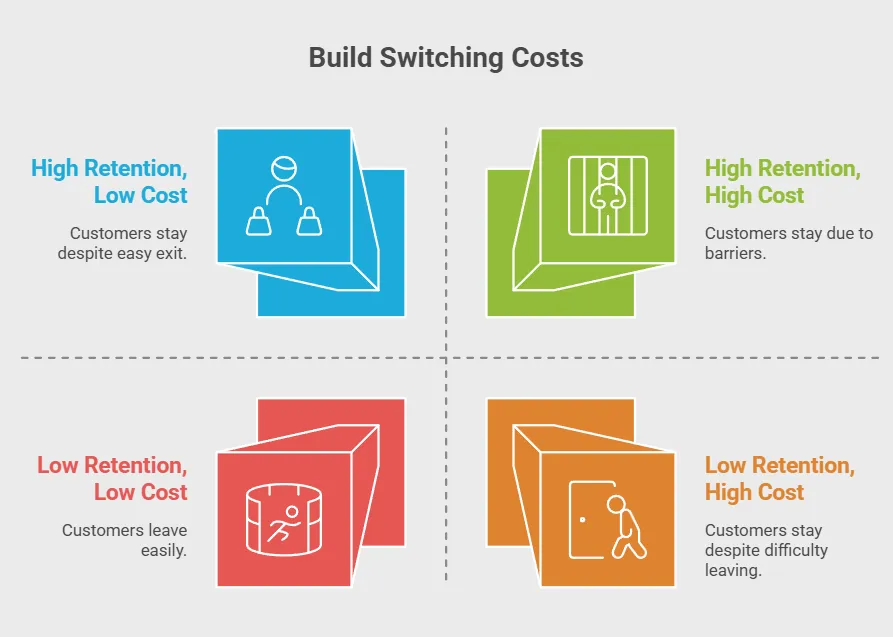
- High-retention categories (insurance, professional services, media) all share one structural feature: meaningful switching costs, whether emotional, contractual, or habitual.
- Low-retention categories (hospitality, transactional retail, social apps) share the opposite: near-zero friction to leave.
Basically, you cannot retention-market your way out of a low-switching-cost product.
The brands that beat their category benchmarks meaningfully almost always do it by manufacturing switching costs that weren't inherent to the category: apps, subscriptions, loyalty tiers, auto-replenishment, or community.
Remember: If your vertical sits in the lower half of this list, the first question should be "what would make leaving us genuinely inconvenient?"
Category 3: Retention's Impact on Revenue and Profit
The financial case for retention is well-established in theory, but it’s not quantified well in practice. From our experience, that’s why it keeps losing budget battles to acquisition (and trust us, customer acquisition has plenty of challenges!).
Anyway, the numbers below put specific figures on the revenue and profit mechanisms that retention drives. Hopefully, that’ll give you the language to make the case internally in terms that your finance and leadership actually respond to.
41. A 5% increase in customer retention can boost profits by 25–95%, according to Bain & Company.
42. It costs 5–7x more to acquire a new customer than to retain an existing one, according to the Forbes article we cited in the intro.
43. According to Blogging Wizzard, existing customers convert at 60–70%. By comparison, new prospects’ conversion rates sit at a measly 5–20%.
44. 65% of a company's revenue typically comes from existing customers, according to Demand Sage.
45. 80% of a company's future revenue is projected to come from just 20% of its current customers. Many sources quote this figure (we’re looking at you, Forbes), but that’s apparently just an extrapolation of the Pareto principle.
46. There’s definitely a grain of truth to that. Apparently, returning customers spend 67% more than new customers, as per Bain & Company.
47. Other sources note that returning customers are more profitable, too. Take Marketing LTB, for example. According to this source, loyal customers are 5x more likely to repurchase, 4x more likely to refer, and 7x more likely to try new offerings.
48. According to Tapcart, the most loyal 10% of customers spend 3x more than the rest; the top 1% spend 5x more.
49. The costs are huge, according to Calabrio. In fact, U.S. companies lose an estimated $136 billion per year to customer churn.
50. Marketing LTB shows you another advantage of reducing churn. Even a 1% improvement can increase your company’s valuation by 12%+ if you run a subscription business.
51. Salesforce shows you the effect of reducing monthly churn from 3% to 2%: you can increase customer lifetime value by 50%! That’s likely due to the compounding effect of longer customer lifetimes.
52. Plus, according to the Zuora Subscription Economy Index, companies with high retention rates grow revenues 3–4x faster than those with low retention.
53. Loyalty leaders grow revenue approximately 2.5x faster than their peers, as per Venn Apps.
54. Marketing LTB also notes that a 2% increase in retention has the same financial effect as cutting costs by 10%.
55. According to Mailmodo, focusing on customer retention can save U.S. companies over $35 billion annually.
Takeaway
The 60-70% conversion rate on existing customers versus 5-20% on new prospects is the single most important number in this entire section.
What it actually means is that every retained customer is a pre-qualified pipeline asset with a conversion probability 3-10x higher than anything your acquisition team is working with.
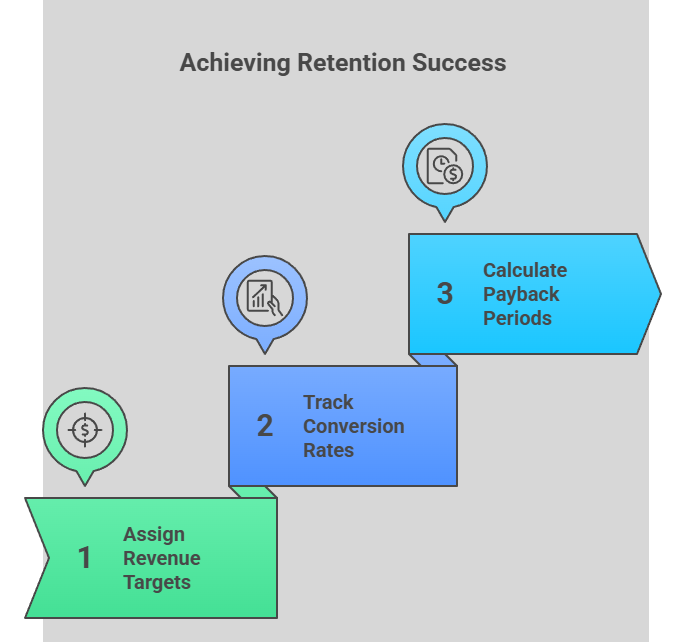
That’s why we advise you to model retention investment like a high-conversion sales channel:
- Assign revenue targets to retention programs.
- Track retained-customer conversion rates separately.
- Calculate payback periods on retention spend.
That brings us to the next point:
Why Customers Churn
Churn analysis tends to surface the same usual suspects: price, competition, and product gaps. But we also like to look at the behavioral data, which tells a more nuanced story.
Where and when customers leave matters as much as why, so the figures below help you understand the main causes.
56. Poor customer service is, unsurprisingly, the main reason why people leave your business. In fact, according to Neil Patel via Blogging Wizard, up to 71% of customers who leave cite it as the primary reason.
57. But the second most common reason for customer churn is arguably more surprising. 68% of churn happens because your customers feel you don’t appreciate them enough, according to Marketing LTB. So yes, price and competition don’t seem to have a lot to do with this.
58. Rethink CX shows us the third most common reason for customer churn: 67% of customers leave businesses due to poor service. And in case you’re wondering, they’re most likely to cite long wait times and unresolved issues.
59. A 2024 Zendesk survey found that 61% of customers stopped doing business with a company specifically due to poor customer service.
60. Marketing LTB paints a similar picture. According to them, 54% of consumers say they would stop buying from a brand after a single bad customer service experience.
61. In subscription businesses, infrequent usage is the second-highest cancellation reason, according to Churnkey State of Retention 2025.
62. The same report shows that unmet expectations remain a persistent churn driver, especially in SaaS. This issue is usually tied to overpromised features and poor onboarding, which leads to underutilized functionality.
63. Surprisingly, price is not the top churn reason, though many executives wrongly assume it is. A PwC Customer Loyalty Executive Survey found that the actual leading cause is a bad experience with the product or service itself.
64. In fact, people don’t have such big issues with prices or price increases. According to Chargebee research, 58% of customers who experienced price increases in 2024 found them justified when companies clearly communicated value. And yes, this means we have a 42% gap representing avoidable churn from poor communication alone.
65. According to The Sales Collective, U.S. sales leaders lose 41% of accounts because of poor follow-up.
66. Churnkey’s report also shows that alternative solutions (yes, your competition) are cited in over 4% of cancellations.
67. But the Sales Collective shows a different number. According to them, better competition is, in fact, behind 31% of customer departures.
68. Involuntary churn (payment failures, expired cards) is largely recoverable, Churnkey says. In fact, 70% of detected involuntary churn was recovered in 2024. Dunning email and SMS campaigns alone achieved an awesome 42% recovery rate.
Takeaway
The finding that executives consistently misattribute churn to price when customers are actually leaving over experience quality is what most caught our eyes.
It’s basically an organizational diagnosis in itself, especially if you believe it too.
Because if you do, your retention strategies are probably built on discounting and competitive pricing responses.
And these tactics fail to move the needle.
The more actionable insight here is the involuntary churn recovery rate: 70% of failed payments recovered suggests that many companies have a billing infrastructure problem dressed up as a loyalty problem.
That’s why we advise you to run a different playbook for involuntary churn than voluntary cancellations.
And that all brings us to the next point:
Customer Retention Strategies That Work
Not all retention tactics work equally well. Even worse, the gap between what businesses invest in and what the data actually supports is wider than most teams realize.
That’s why, below, we covered the channels, programs, and interventions with the most consistent evidence behind them.
69. According to ringly.io, brand loyalty programs generate an average 5.2x ROI. That’s why 83% of companies running them are reporting positive returns. In fact, members are generating 12–18% more revenue per year than non-members.
70. Plus, 70% of consumers spend more with brands that have loyalty programs, according to nudgenow.com.
71. That’s because, as nudgenow.com suggests, customers who feel valued are 82% more likely to repurchase, even when given the option to switch brands.
72. But make sure your program is good. According to Marketing LTB, 72% of loyalty program members are more likely to stay with a brand specifically because of the program.
73. The kind of customer loyalty program you run also matters. In fact, tiered loyalty programs outperform flat point systems by 1.8x ROI. VIP tier members spend 73% more per order and make 3.6x more purchases annually than non-tier customers, according to data from Ringly.
74. Another useful customer retention tactic is proactive outreach before usage declines. According to Focus Digital, that approach delivers the highest retention lift at +14%. Yes, it outperforms every other single tactic studied across 312 companies.
75. Blogging Wizard gives us an indication of what digital channel we can use for that outreach. According to them, email is the most popular retention channel, used by 89% of marketers, and delivers an estimated 4,200% ROI.
76. Envive data points us in the same direction. They note that email drives 38% of retention program engagement and 52% of win-back campaign success.
77. However, you need to be persistent. According to Envive, three-email abandoned cart sequences recover 29% of abandoned carts, though single-email sequences recover just 18%. And if you’re adding SMS to the mix, you lift recovery to 38%.
78. When you do it is just as important as how often you do it. As per Marketing LTB, re-engagement email sequences sent at 30, 60, and 90 days recover 6–22% of inactive customers, depending on vertical.
79. Plus, according to Marketing LTB, brands that call new customers once after purchase see 17% higher lifetime loyalty.
80. Ringly data suggests you should build a personalized experience for your existing customers. If you do, they’re 60% more likely to become repeat buyers. Plus, 64% are willing to spend more with brands that remember them.
81. A study published by the International Conference on Future Networks & Distributed Systems shows that you can be even more successful with AI-powered personalization. This tactic increases your conversion rates by 10–15% and your customer lifetime value by up to 30%.
82. Companies with strong omnichannel engagement retain 89% of customers, vs. 33% for companies with weak omnichannel implementation, according to Invespcro’s State of Omnichannel Shopping.
83. You should also include social media in your marketing mix. Customers who interact with you at least once per month on social platforms show 21% higher retention, as per Marketing LTB.
84. Subscription businesses that offer flexible pause or skip options reduce churn by 20-30%, according to Trend Track.
85. NPS scores correlate directly with retention. As per Marketing LTB, every +10 NPS points corresponds to approximately 5–8% higher retention.
86. Community members show 2–3x higher lifetime values than non-participants, though community-building takes 12–18 months to generate compounding returns, according to Genesys Growth.
87. Companies with strong customer experience grow revenue 1.5–2x faster than competitors, says data from Marketing LTB.
88. Omnichannel customers show 30% higher lifetime values than single-channel customers, as per Genesys Growth.
89. Upselling existing SaaS customers generates 70–95% of revenue growth in top-performing companies, according to Demand Farm.
90. 76% of companies consider CLV an important metric, but only 42% can actually measure it accurately, says the Blogging Wizard.
Takeaway
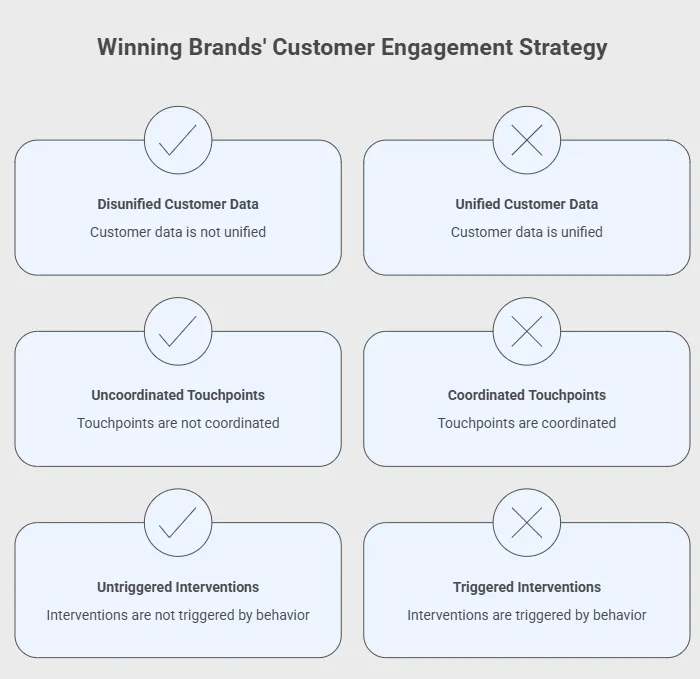
The 89% vs. 33% omnichannel retention gap is the number that should be driving your infrastructure investment decisions.
Basically, the brands winning on lifetime value are winning because their customer data is unified, their touchpoints are coordinated, and their interventions are triggered by behavior.
So here’s what we advise you: examine your retention stack.
If it’s a collection of disconnected point solutions, you’re likely producing fragmented experiences that structurally cap your retention ceiling regardless of how good your content is. The tactics in this category work best if you combine them.
What Do These Numbers Mean for Marketers and Growth Teams?
The statistics we cited above point to conclusions specific enough to act on today. Apart from what we already discussed, we advise you to:
- Match metrics to your model first. Ecommerce teams should anchor on repeat purchase rate and time-to-second-purchase. Subscription and SaaS teams need voluntary and involuntary churn tracked separately, plus NRR as the real performance indicator.
- Focus on early retention. Customers who repurchase within 30 days of their first order have dramatically higher 12-month retention than those who take 90. First-to-second-purchase speed is a leading indicator worth tracking independently.
- Start at the beginning when churn is high. The quality of your onboarding initiatives and early activation can and do trigger downstream retention problems.
- Benchmark against the top quartile, not the average. Matching the category average in a low-retention vertical just means losing customers at the same rate as everyone else.
- Sequence your tactics deliberately. Fix involuntary churn first, then optimize early lifecycle flows, then build winback sequences, then layer in loyalty. Programs built on a leaky foundation compound the wrong way.
- Test non-monetary interventions before discounting. Discounts produce retention lift that disappears the moment they stop. Even worse, it frequently costs more in margin than the retained customer is worth.
Improve Your Customer Retention with inBeat Agency
The businesses winning on retention are not necessarily running better campaigns (though they sometimes do, so take creatives into account, too!).
Our point is they most likely have better data, tighter alignment between acquisition targeting and product fit, and interventions triggered by customer behavior.
What these statistics should produce is three things, in order:
- An honest baseline measured correctly for your model
- A specific target set against the right benchmark
- And one high-confidence experiment designed to isolate causation (not just correlation)
If you want help building that system, inBeat Agency works with growth teams to turn retention data into programs that compound. Get in touch today to start with a retention audit.
FAQ
How is customer retention measured and calculated?
To calculate customer retention, use the formula: [(End customers – New customers acquired) / Start customers] × 100. The right period depends on your purchase cycle. We recommend monthly for subscriptions, annually for most ecommerce and service businesses. However, we don’t advise you to rely on CRR alone; repeat purchase rate and cohort retention add important granularity.
What factors influence customer retention rates?
Customer service quality, onboarding experience, product-market fit, pricing fairness, and how deeply embedded the product is in a customer's workflow. Structural factors, like your billing model, switching costs, and purchase cycle matter, too.
How does customer retention impact business growth and revenue?
Customer retention extends LTV, reduces CAC payback, improves upsell conversion rates, and generates referrals that lower customer acquisition costs. A 5% retention improvement can increase profits by 25–95%. For subscription businesses, an NRR above 100% means the existing base grows revenue without any new acquisition.
What is considered a good retention rate?
A good retention rate depends on your business model. B2B SaaS: 90%+ annually. Ecommerce: 40%+ is strong against a 30% average. B2C subscriptions: 72–80%. Professional services: 83–85%. Hospitality: around 55%. The most useful benchmark is always the top quartile of your specific vertical, not the cross-industry average.