


.svg)
.svg)
.svg)
.svg)

.svg)


Social commerce has changed how products are found, evaluated, and purchased on social media.
Buyers no longer treat platforms as a discovery layer only. For many categories, social media now plays a direct role in the purchase decision itself.
This shift affects how brands plan creative, measure performance, and allocate budget across channels.
It also changes what “conversion” looks like, since social proof, creator content, and platform-native features shape buyer confidence before a checkout even happens.
This article breaks down the most relevant social commerce statistics and explains what they reveal about buyer behavior, platform dynamics, and format performance.
Here’s what the data shows!
Pro tip: Treat your social commerce as a performance channel. inBeat Agency can help you connect creator content to real conversion results.
TL;DR
If you're short on time, here are the key social commerce statistics shaping buying behavior right now:
- The global social commerce market is valued at $1.63 trillion and is projected to grow at a CAGR above 30%, driven by in-app shopping and creator-led sales.
- Social commerce sales in the U.S. reached $87 billion, with year-over-year growth above 20%, and are expected to surpass $100 billion next year.
- More than half of Gen Z and Millennials have purchased social media in the past few months, far outpacing Gen X and Baby Boomers.
- Video-led formats dominate. Video commerce accounts for over 40% of total social commerce activity, with live shopping and short-form video driving impulse purchasing.
- Smartphones account for over 90% of social commerce transactions, reinforcing mobile-first buying behavior.
- Instagram influences tens of millions of buyers annually, with over half of users purchasing after seeing a product on the platform.
- TikTok Shop is approaching a quarter of total U.S. social commerce sales, while platforms like Pinterest deliver higher ROAS and higher average order values.
- Creator recommendations directly impact sales. Nearly 56% of Gen Z and Millennials report buying a product based on a creator’s endorsement.
What Is Social Commerce?
Social commerce refers to buying products directly within social media platforms. The experience combines product discovery, evaluation, and payment without sending users to an external store.
Unlike traditional e-commerce, where users rely mainly on product descriptions and reviews on a website, social commerce uses native signals.
These include user-generated content, comments, creator recommendations, customer reviews, and real-time interaction.
In our experience, the common formats that perform best include shoppable videos, product tags in posts, in-app checkout, and live shopping events.
Many platforms also support messaging-based sales and AI-driven product recommendations that guide buyers during the decision process.
The result is a purchase flow shaped by social interaction rather than by standalone product pages.
For in-person activations and live shopping, brands are testing gesture-controlled interfaces that let attendees trigger product reveals or purchase prompts—an emerging bridge between experiential events and social commerce.
Why Social Commerce Matters For Your Brand
Social commerce changes what “good marketing” looks like.
We’ve seen creative work as a traffic driver plenty of times. Done well, it could be a product explanation, the trust layer, and the conversion trigger. For Miro, for instance, our work with 25 creators led to over 200 million impressions (so far).
Here’s one of these UGC posts that performed very well:
On the other hand, if your UGC is weak, your in-platform sales will feel weak too, even if your site converts fine.
We know that social commerce also changes measurement. In-app checkout and social commerce tools reduce friction, but they can limit what you see on the customer side. That forces cleaner prioritization: you need to know which platform features, formats, and creator-led promotions are actually moving revenue.
There’s also a budget reality. Social selling competes with traditional digital advertising spend.
The teams that win here stop treating social as a top-of-funnel line item and start treating it like a performance surface with its own conversion logic.
Social Commerce Statistics
Below are the next social commerce statistics that highlight how buyers behave, what formats influence decisions, and where conversions happen:
Buyer Behavior and Generational Adoption Statistics
This category is about who buys through social, what pushes them to act, and how preferences are split by age.
Emplifi, in their report, stated that:
1. More than half of Gen Z (53%) and Millennials (56%) have purchased via a social media platform in 2025.
2. In the same dataset, Gen X (39%) and Baby Boomers (29%) report the same behavior at much lower levels.
3. 42% of Gen Z and 38% of Millennials say the appearance of a post influences their decision to purchase.
4. 31% of Gen Z say they’re more likely to buy if the brand uses humor in its marketing.
5. 30% of Gen Z and Millennials are more likely to engage with a brand through a direct message on the brand’s social account.
Bazaarvoice adds detail on how this behavior shows up inside the shopping journey:
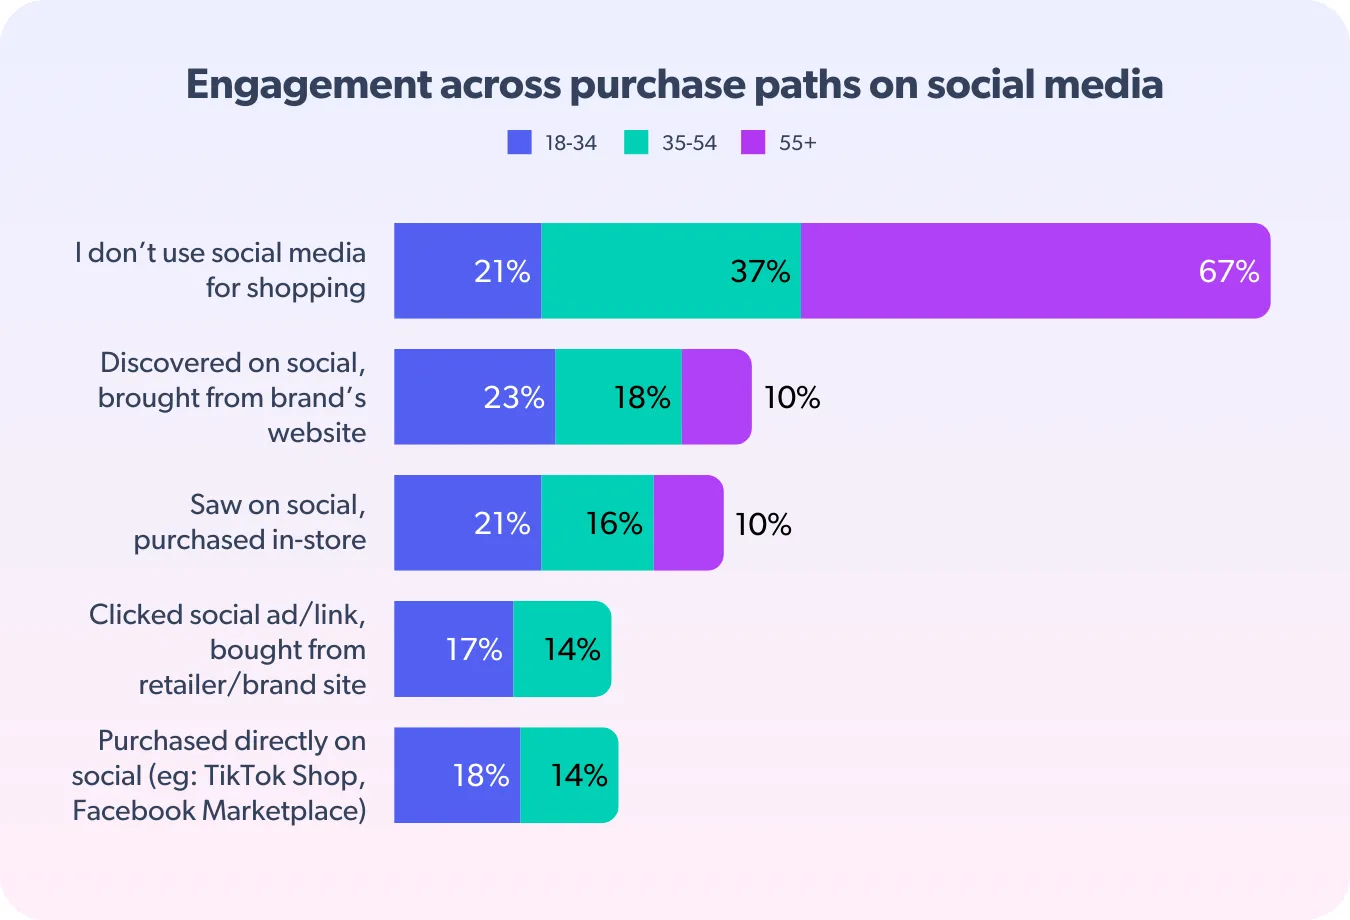
6. Almost 80% of Gen Z and Millennials integrate social media into their shopping journey.
7. In the 18-34 group, 38% increased spending on social media by 20% or more compared to other demographics.
8. 46% of social shoppers cite better discounts as a top reason for purchasing through social platforms.
9. Nearly 56% of Gen Z and Millennials say they’ve purchased a product based on a creator’s recommendation.
10. Creator influence is strongest in health and beauty (53%) and apparel (41%).
11. About 42% of Gen Z and younger Millennials made 3-5 purchases in the past six months.
And a new survey from Horowitz Research shows that:
12. Nearly half of US consumers say social media is their primary way to learn about brands and products.
13. 13% of adults made purchases through influencer pages in the last month, which makes it a good way to have more sales.
Takeaway: Gen Z and Millennials buy directly through social at high rates, and their purchase triggers are visual-first. Older cohorts still buy, but they need stronger proof formats. If your creative is built for one age band, you will force your ROAS to carry the gap.
Format and Conversion Driver Statistics
Formats decide conversion paths in social commerce. This category focuses on what people respond to: short-form, shoppable videos, AR product try-ons, and live shopping events.
Bazaarvoice also gives a clean read on format influence:
14. Nearly 46% of shoppers say short-form videos (TikTok, Reels, YouTube Shorts) are the most influential format for purchase decisions.
15. Among older shoppers (55+), customer testimonials (49%) and product demos (42%) rank as preferred formats for purchase consideration on social.
16. For younger consumers, before-and-after results (36%) and product unboxing (30%) are cited as influential formats.
Now tie that to platform-level format dominance:
17. Mordor Intelligence also said that video commerce captured 43.71% of the social commerce market share.
AR is the other lever that reduces hesitation. Snapchat’s business research focuses heavily on attention and purchase behavior:
18. 72% of Snapchatters agree that AR ads capture their attention more effectively than traditional ads.
19. 61% are more likely to purchase after an AR experience.
20. 81% of users use AI/chatbot features as a “shopping buddy” for ease and personalization.
21. 88% use social media to discover new products, and 44% use it to evaluate items for consideration and purchase.
Finally, live shopping. It’s not universal across every market, but participation and purchases are real in younger cohorts, based on a cited study.
22. Nearly 60% of Gen Z and millennial consumers say they’ve attended a virtual shopping event on social media, and over half report purchasing during the event.
Takeaway: Short-form video drives action for younger cohorts. Testimonials and demos do more work for older cohorts. And AR speeds decisions by reducing uncertainty, and live shopping can convert when the product and audience match the format. A good creative plan combines all these alternatives.
Pro tip: Creator-led sales don’t happen by accident. In this breakdown of creator economy trends, we show you how brands turn influence into repeatable revenue.
Mobile and Device Behavior Statistics
Social commerce is mostly built around mobile behavior. These stats explain why desktop-first thinking limits performance and why checkout, creative, and load speed matter more inside apps.
Data from Mordor Intelligence also shows that:
23. Smartphones account for 91.34% of total social commerce transactions.
24. Mobile-driven social commerce is growing at a 31.23% CAGR, outpacing most other digital commerce segments.
25. Entertainment-led formats combined with impulse purchasing continue to accelerate mobile-first buying behavior, according to market analysis.
Now layer in behavior signals from platform research, another Snapchat study stated that:
26. 92% of shoppers say being able to complete everything in one place online makes them shop more frequently.
27. 83% of consumers say online purchasing has become easier, leading them to buy more, especially for electronics.
Takeaway: Social commerce relies on mobile buyers. If your checkout or product presentation breaks on a phone, conversion drops before trust even forms.
Platform-Specific Shopping Intent Statistics
Not all platforms drive the same type of buyer intent. These stats clarify what each ecosystem does best, starting with Instagram.
Tiktok Shop
TikTok Shop is built for fast product discovery and creator-led purchase triggers. These numbers show how quickly it’s capturing social commerce demand:
28. Emarketer stated that TikTok Shop is expected to surpass $20B in sales and reach $30B+ later in the forecast period for 2029.
29. They also stated that TikTok Shop accounts for 18.2% of US social commerce and are projected to reach 24.1%.
30. Retail Dive says that in 2026, half of US social shoppers are projected to make purchases on TikTok.
31. They also talk about how TikTok Shop’s sales are expected to comprise nearly a quarter of all US social commerce sales by 2027.
32. During the most recent Black Friday and Cyber Monday campaign period, TikTok Shop saw nearly 50% more US shoppers compared to the same period the year before.
33. Also over the four-day shopping window alone, TikTok Shop recorded more than $500 million in sales, reflecting sharp short-term demand spikes.
Instagram Shopping
Instagram is one of the most used social media platforms for commerce. In an Instagram shopping research from Resourcera, they stated that:
34. 2.1 billion users actively shop on Instagram every month.
35. About 49% of Gen Z social media users have purchased at least one product using Instagram, compared with 46% of Millennial social media users.
36. Among older groups, 36% of Gen X social media users and 14% of Boomer users have purchased a product using Instagram.
37. Around 200 million users interact with shopping posts or visit business profiles daily.
38. 83% of Instagram users search for new products and brands on the platform.
39. 90% of users follow at least one business account.
40. In the U.S., 42% of social media users report purchasing at least one product via Instagram.
41. Instagram generated $37.2 billion in social commerce revenue in a single year.
42. 54% of users say they purchased a product after seeing it on Instagram.
43. 130 million users tap product tags every month.
44. 51% of Instagram shoppers are female, while 47% are male.
Youtube Shopping
YouTube Shopping plays a different role in social commerce, with search-driven video discovery influencing what people buy and which brands they trust.
According to YouTube’s Culture & Trends Report:
45. 43% of 14–24-year-olds say they feel more loyal to brands they shop based on YouTube creator recommendations.
46. CoryxKenshin’s self-published manga sold 200,000 copies in the first week, promoted through his YouTube channel.
47. YouTube’s analysis of the top 1,000 most transacted shopping videos found that more specific titles help viewers find what they need when they need it.
Facebook Marketplace
Facebook plays a different role in social commerce. These stats show why it still holds weight in direct purchases and resale activity.
48. Facebook Marketplace is reported to have 1.1B monthly active users.
49. 40% of Facebook users actively buy on Facebook Marketplace, showing it still plays a major role in peer-to-peer and local commerce.
50. Sprout Social also stated that adults were more likely to purchase directly on Facebook in 2025. However, this puts them behind TikTok (45.5%) and just slightly ahead of Instagram (37.3%).
Pinterest Shopping
Pinterest may sound like a social media that isn’t usually used for social commerce, but in fact, it has good numbers, depending on the products that you offer.
According to Sprout Social, Pinterest shows a different intent profile:
51. 85% of weekly Pinners have purchased a product after seeing a brand’s pin.
52. Pinterest delivers a 32% higher ROAS than other digital platforms.
53. Users spend 2× more when shopping on Pinterest compared to other social platforms.
54. 96% of searches on Pinterest are unbranded, creating strong discovery potential.
55. One-third of Pinterest users earn $100K+ annually.
Snapchat Shops
Snapchat Shops supports purchase decisions through guided discovery rather than open browsing:
56. 65% of Snapchatters say AI-powered styling guides help them discover new outfit ideas based on recent purchases.
57. 77% of Snapchatters say visual search helps them find apparel items faster and easier (vs 50% of non-Snapchatters).
58. Nearly all consumers (92%) say they would be willing to purchase directly from brands on social platforms instead of an online marketplace, especially with good deals and discounts.
Takeaway: Social commerce is effective because people shop differently on each platform. Attention, trust, and conversion don’t happen in the same way everywhere.
Brands that align their creative, format, and checkout with platform behavior tend to see cleaner performance. But those who try to force one approach across all networks don’t.
Pro tip: If you want a more data-backed view of how social selling converts across formats and platforms, this roundup of social selling statistics breaks down which behaviors and placements drive real purchase activity.
What These Numbers Mean For Brands And Retailers
The social commerce statistics above point to a simple reality: each social platform is a different purchase environment with its own rules.
Here’s what that means in practice:
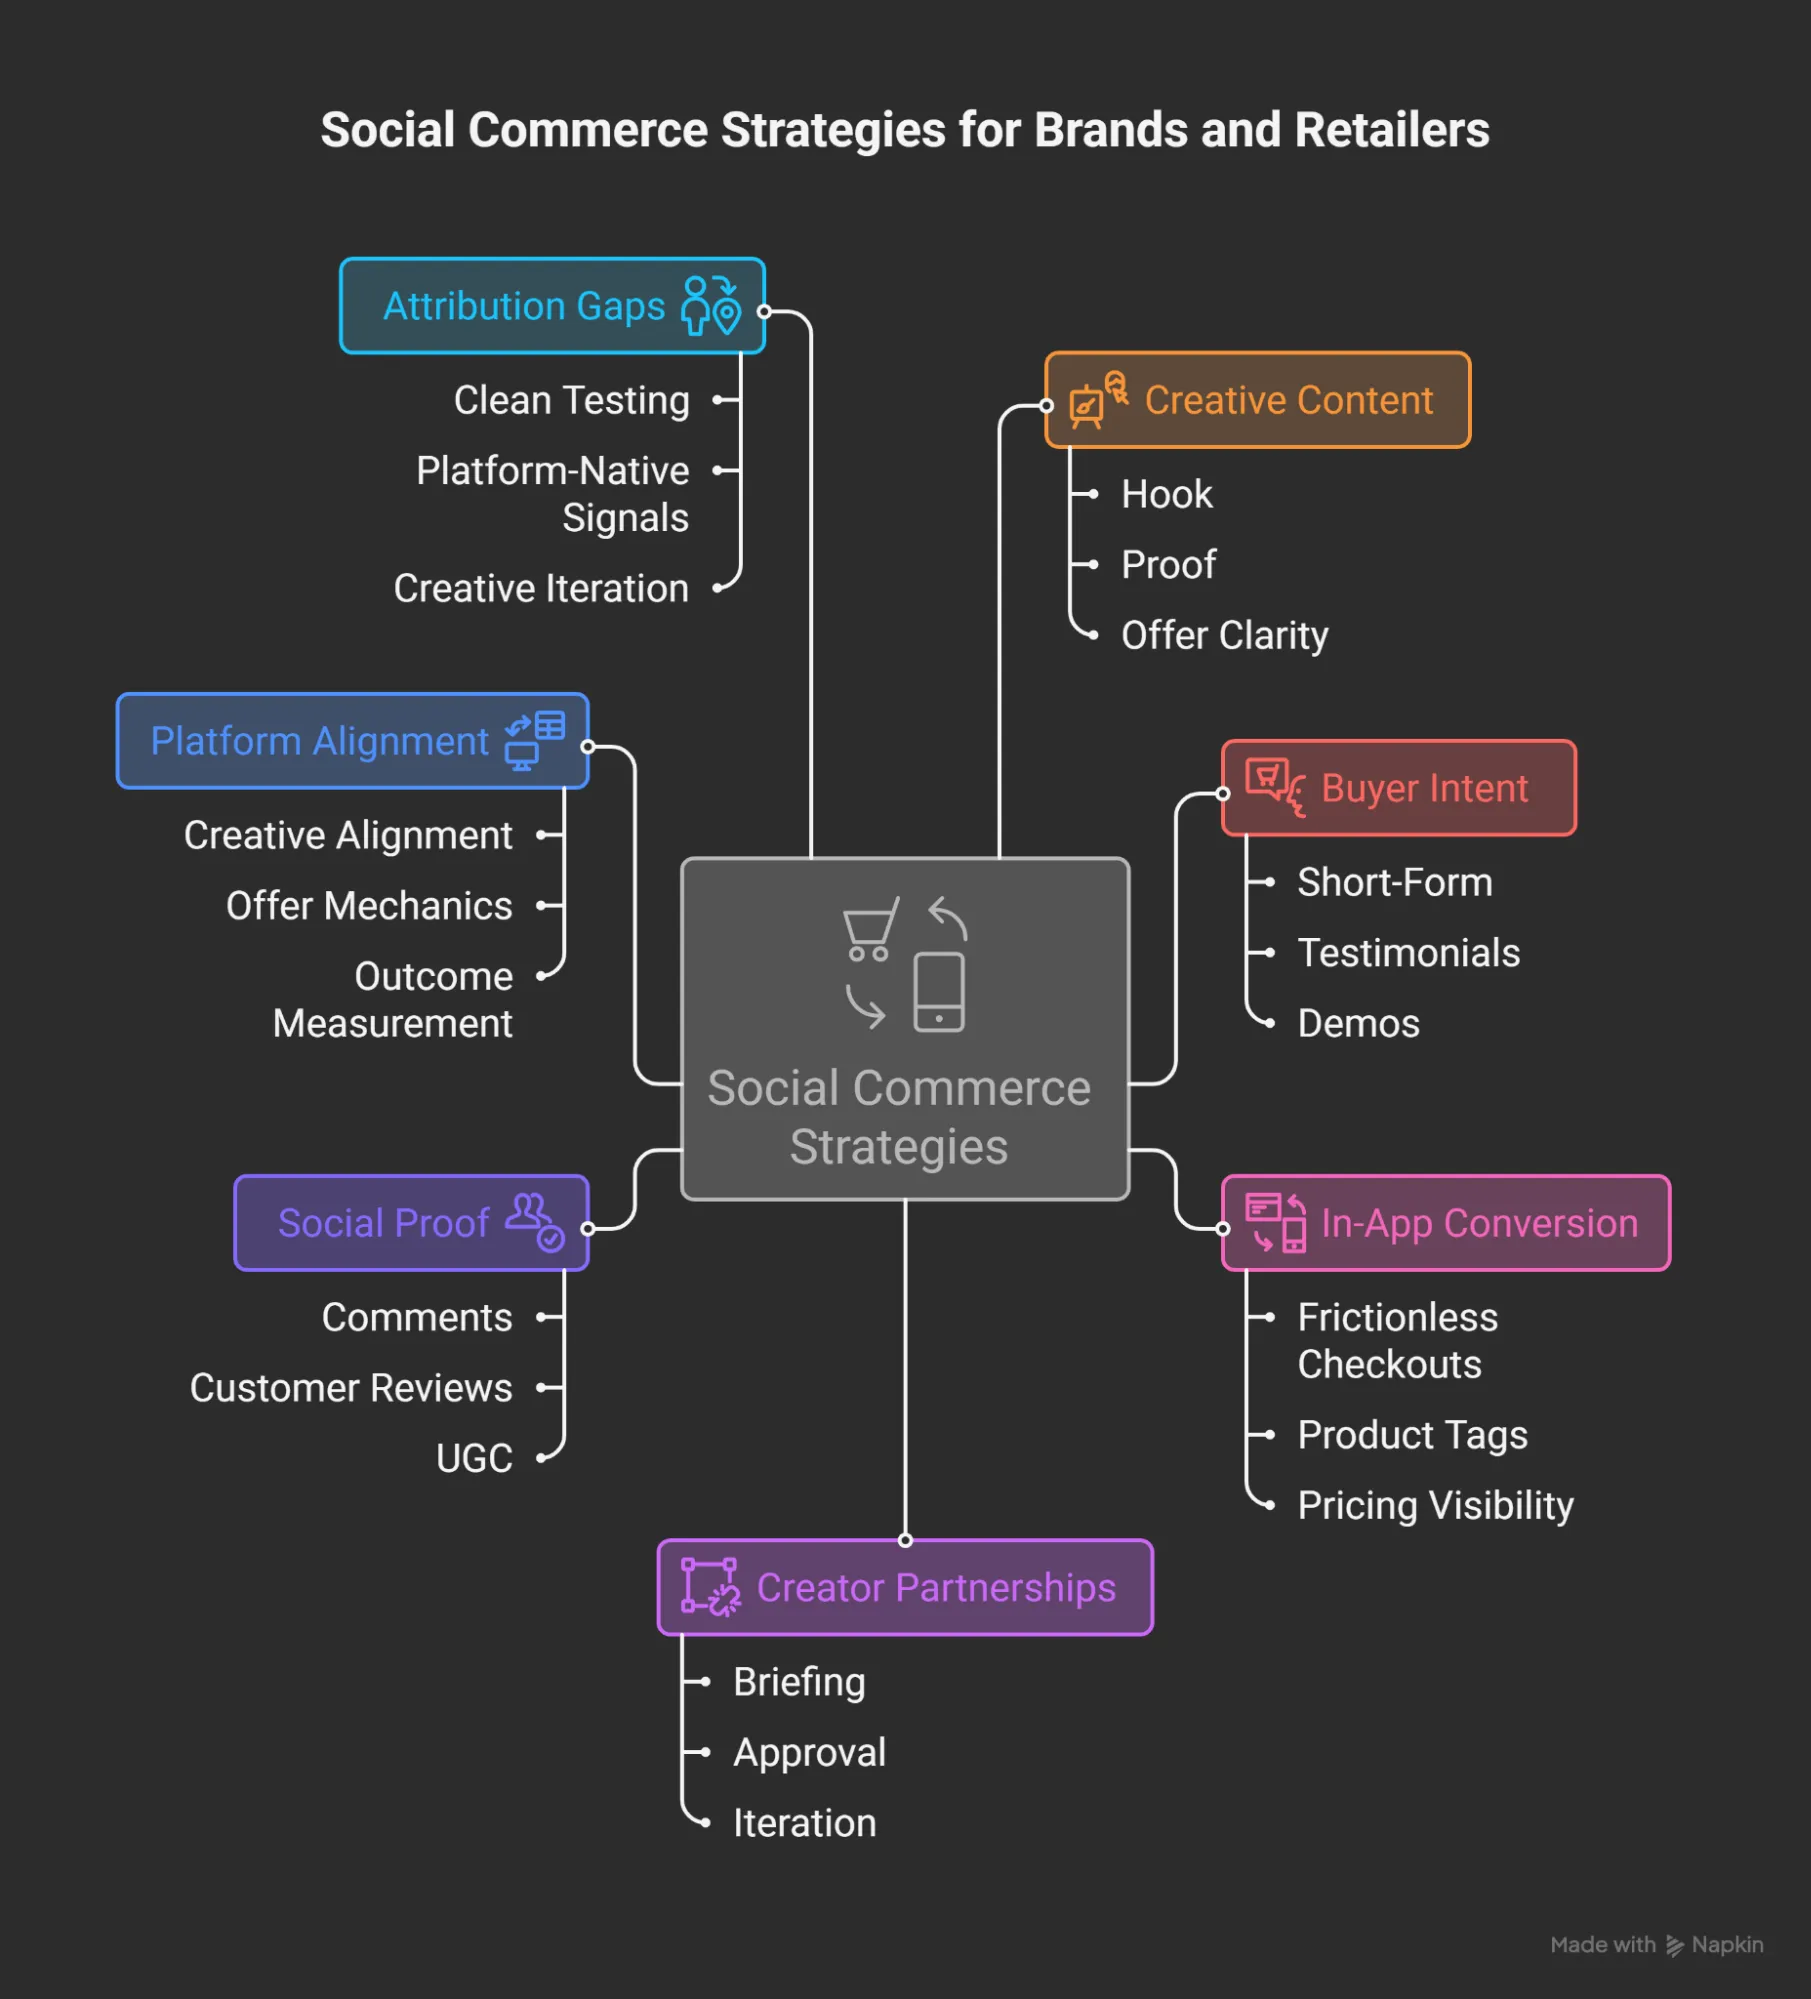
- Build creatively like it’s the product page: Your hook, proof, and offer clarity need to live inside the asset. We advise you to assume many buyers will not click out.
- Match formats to buyer intent: Short-form drives fast decisions. We’ve seen how testimonials and demos do more work for skeptical segments. Treat this as a segmentation problem, not a “content variety” problem.
- Design for in-app conversion: Frictionless checkouts win. So do clear product tags, pricing visibility, and fast answers to common objections.
- Treat creators as a performance lever: Creator-led promotions can move volume quickly. That only holds if you can brief, approve, and iterate without delays.
- Use social proof on purpose: Comments, customer reviews, and UGC are not decoration. They lower perceived risk. We recommend you to plan them as part of the funnel.
- Stop forcing one platform playbook: Each network rewards different buying behavior. Align creative and offer mechanics to the platform, then measure outcomes accordingly.
- Expect attribution gaps: In-platform sales reduce visibility into user paths. Use clean testing, platform-native signals, and consistent creative iteration to stay in control.
Pro tip: If you want clearer direction on where paid social fits with social commerce sales, this ecommerce social media advertising strategy guide breaks down how to connect ads, creative, and conversions for stronger results.
Apply These Social Commerce Statistics to Your Growth Plan
Social commerce keeps growing because it fits how people already shop on social media. They want speed, proof, and a short path to purchase.
The brands that win treat it like performance marketing, with creative systems that can ship fast results and improve weekly.
Use these social commerce statistics to pressure-test your platform mix, your creator strategy, and your format priorities. Then tie every decision back to conversion signals you can measure.
If you want help turning this into a repeatable engine, inBeat Agency works with performance teams to connect creator content, UGC, and in-platform checkout to real sales outcomes.
Share this post with your team, and reach out to us when you’re ready to tighten your plan!
FAQs
What are Social Commerce Platforms, and How Do they Work?
Social commerce platforms allow users to browse, evaluate, and purchase products directly inside social networks. Unlike traditional e-commerce sites, these platforms integrate discovery, social proof, and checkout into a single flow, creating a seamless social commerce experience optimized for mobile users.
Why are Social Commerce Strategies Effective for Brands?
Social commerce strategies work because they align with how people already shop on social media. Brands can improve conversion rates compared to traditional social media marketing that relies on external landing pages by combining algorithm-driven discovery, personalized experiences, and in-app checkout.
How do Social Buyers Behave on Social Networks?
Social buyers rely heavily on visual content, social proof, and peer validation. Their social buying habits vary by platform and age group. For Generation Z, mobile social commerce dominates. They respond faster to short-form video, creators, and native checkout features than to static ads.
How Does Influencer Marketing Impact Social Commerce Sales?
Influencer marketing plays a direct role in driving purchases on social platforms. Social media influencers shape trust and product understanding, while well-executed influencer campaigns help brands convert attention into sales, especially when creators demonstrate real product use.
Which Social Shopping Features Drive Higher Conversions?
Features that reduce friction perform best. This includes shoppable posts, native storefronts like Instagram Shops and Facebook Shops, and immersive tools such as virtual and augmented reality, which help buyers evaluate products before purchasing.
How do Social Media Ads Support Social Commerce Performance?
Social media ads are most effective when they support in-platform buying behavior. When ads are integrated into major marketing platforms and aligned with native checkout, creator content, and product tagging, they reinforce discovery and accelerate conversions instead of interrupting the shopping flow.