


.svg)
.svg)
.svg)
.svg)

.svg)


Consumer spending is one of the clearest windows into how people actually behave in the economy. While opinion surveys capture attitudes and intentions, spending data shows real decisions made with real money: what consumers prioritize, where they cut back, and how those choices change over time.
For marketers, this data is especially powerful. It connects macroeconomic forces, like inflation, interest rates, tariffs, and wage growth, to day-to-day purchasing behavior across categories, channels, and price points.
Whether consumers are shifting spend from goods to experiences, trading down to private labels, or increasing online and mobile purchases, these patterns directly influence demand, messaging, and media strategy.
In this article, we break down consumer spending statistics to answer two core questions:
- Where are people spending their money?
- How are they spending this money, and why does it matter for brands?
With these carefully selected statistics from reputable, verified sources, brands and the teams behind them can get valuable, practical insights.
P.S. Want more customers for your business? Discover the Top User Acquisition Agencies for Scalable Growth.
What Consumer Spending Can Tell Brands
For brands and their marketers, consumer spending data is more than an economic indicator. In fact, it’s a real-time signal of intent, confidence, and shifting priorities.
Where people allocate their money reveals what they value now, not what they say they plan to buy later.
At a high level, spending patterns help marketers answer three critical questions:
1. How confident do consumers feel?
When discretionary spending rises, especially in categories like travel, dining, electronics, or home upgrades, it usually reflects confidence in income stability and future prospects. Conversely, a pullback toward essentials (groceries, utilities, basic apparel) signals caution. Tracking this shift helps marketers decide when to push premium messaging versus value-led positioning.
2, Which categories are winning or losing mindshare?
Consumer spending and economic data show which product categories are gaining momentum and which are plateauing or declining. For example, sustained growth in digital services, subscriptions, and experiences may indicate a long-term behavioral shift. Marketers can use this insight to adjust product/ service offerings or brand messaging to keep up with the shift.
3. How is buying behavior changing?
Spending statistics also reveal how people buy things. For instance, data from ecommerce and social channels can tell whether online spend exceeds in-store. Similarly, you can learn a great deal about device-specific buying and use that for targeting. Other important takeaways are repeat purchases versus big-ticket buys.
But why does it all matter?
Consumer spending data can inform channel strategy, creative formats, and funnel design. A rise in frequent low-value transactions, for instance, favors retention marketing and lifecycle campaigns over one-off acquisition pushes.
According to aggregated consumer insights tracked by organizations such as Nielsen and McKinsey & Company, brands that align messaging with prevailing spending behavior consistently outperform those relying on demographic targeting alone.
Pro Tip: Look out for key consumer spending data, like Consumer Price Index (CPI), released monthly/quarterly by the US Bureau of Economic Analysis (BEA), the US Bureau of Labor Statistics, and the Census Bureau. Private organizations like the National Retail Foundation and CNBC also release insights and reports related to consumer spending trends.
Consumer Spending Statistics
At inBeat, we live and breathe data. We deep-dived into many reports, surveys, and research studies to identify notable statistics and facts on consumer spending and behavior. For your ease, they’re divided into different categories.
General Consumer Statistics
Here are some top-level statistics that reveal baseline findings about how the modern consumer spends and what role it plays in the economy.
1. Consumer spending drives two-thirds of the US economy. The American economy, the world’s largest, is consumption-driven, and that’s what has helped it avoid recessions many times throughout history. (US Bank)
2. The average annual expenditure for all consumer units in 2024 was $78,535, while the national income before taxes was $104,207. These numbers clearly show that the average consumer spends a significant portion of their earnings and that disposable personal income may be dwindling in recent years. (BLS)
3. Discretionary spend was up in 2025 despite inflation concerns. Interestingly, a JP Morgan report from the summer of 2025 indicated that spending on eating out, travel, and subscriptions remained strong despite inflationary pressures. (JP Morgan)

4. Housing is the biggest expenditure for all US consumers. On average, $25,436 went toward housing costs (mortgage/rent, utilities, etc.) in 2023, followed by transportation and food. (Statista)
5. Consumer sentiment is at its lowest in years, despite rising spending. Consumer sentiment, or confidence, reflects how optimistic or pessimistic consumers are about the overall economy, job market, and their personal finances. This means spending could go down in the near future. (US Bank)

Retail Spending Statistics
Of course, nothing gives more granular insights into consumer behavior and expectations than retail spending data. Whether it’s grocery shopping, apparel, food, or services, what people spend at stores says a lot, especially for retailers or brands that supply them.
6. The US retail sales growth is projected to trend around 0.40 percent in 2026 and 0.30 percent in 2027. That means an increase in retail spending is expected in the near future, but it won't be significant, which aligns with consumer sentiment. (Trading Economics)
7. Retail spending in the US has been consistently increasing since 1992, with a decline only recorded during the 2008 financial crisis. In fact, it’s over $7 trillion in 2024, the highest it's ever been. This is obviously due to the increasing population, but it also shows that retail remains a dominant player. (Statista)
8. 81% of retail shoppers conduct their research online before actually buying a product. Online presence is non-negotiable at this point, even for brands that largely sell in brick-and-mortar stores. Consumers do their homework: they compare prices, check reviews, and see competitors before purchase. (GE Capital Retail Bank)
9. Retail media advertising spend is projected to grow to over $155 billion worldwide in 2026 and reach $175 billion by 2028. Amazon Ads, Walmart Connect, and Target Roundel lead the retail media platforms that advertisers use. (Adtellingent)
Holiday Consumer Spending Statistics
Consumer spending sometimes breaks records during the holiday seasons, as people shop for gifts, experiences, and travel. It’s also the time of the year when many brands see the most sales (and advertise more aggressively to get those sales). And holiday spending is sharply influenced by economic conditions and vice versa.
Needless to say, for any consumer brand, monitoring key data ahead of the holidays is crucial.
10. Ecommerce spend during the 2025 holiday season reached $258 billion, up 6.8% from the year before. Also, many shoppers turned to ‘buy now, pay later’ options ($20 billion spent). This data clearly indicates that people are willing to go to great lengths to spend during the holidays, even during tough economic times. (Retail Dive)
11. The NRF had predicted the 2025 holiday season to see $1 trillion in consumer spending, the highest ever. And this spending has been consistently increasing year-on-year. It re-establishes the fact that brands have a massive capitalization opportunity before and during the holiday season each year. (Associated Press)
12. Many shoppers feel financial strain when shopping for gifts during the holidays. This rings true in times of inflation and economic uncertainty, as spending power declines and consumers become more cautious. Also, overcrowded stores are a pain point for 44% of American shoppers, which is why so many people turn to online stores for gift shopping each year. (Survey Monkey)
13. AI has yet to make a mark on holiday shoppers, but it does bring in clicks. In SurveyMonkey’s survey, 84% of Americans didn’t report using AI for gift decision-making. However, Adobe Analytics found a contrasting reality, at least with shoppers who purchased gifts online. In 2025, Generative AI generated 693% higher clicks to retail sites. Vivek Pandya, Adobe Digital Insights Lead Analyst, says:
“This 2025 holiday season, consumers embraced generative AI more than ever as a shopping assistant in their purchasing decisions.” (Vivek Pandya, Adobe Digital Insights Lead Analyst)
14. 80% of consumers planned to use social media to find gifts for their loved ones. It’s clear that social media has a powerful influence on people’s shopping habits, but it’s even more impactful when it comes to gift-giving. Consumers check out platforms like Instagram, TikTok, and Pinterest to find interesting and quality products. (Sprout Social)
Ecommerce and Social Media User Spending Statistics
Ecommerce, and particularly social media commerce, has skyrocketed in the last decade. The convenience, speed, and savings are pushing more consumers to go online and buy everything from essentials to high-ticket items worth thousands. And the numbers show that.
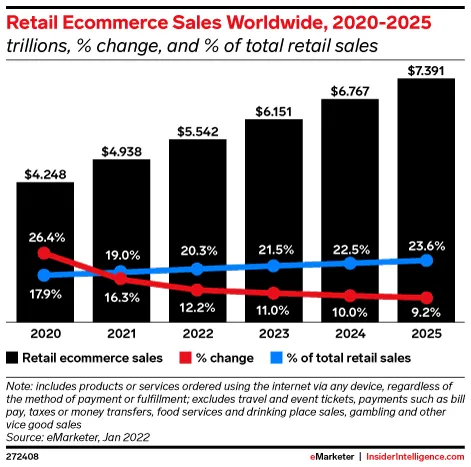
15. Global ecommerce sales are poised to exceed $7.3 trillion in 2025. This has been the trend for a while, as more countries embrace ecommerce and buyers get more comfortable with online shopping. (Emarketer)
16. Social commerce revenues are projected to cross $1 trillion by 2028. Like total ecommerce, social media shopping has been consistently growing, too. This comes on the heels of integrated shopping within shopping media apps like TikTok Shop, which allow brands to sell directly on social media. That further streamlines the process and accelerates the time from discovery to purchase. (Statista)
17. In 2023, global social selling revenue was $571 billion, and is expected to grow continuously through to the end of the decade. For brands, that just means social media is a must-have in their marketing strategy, regardless of geography. Social media shopping is now a global phenomenon. (Statista)
18. 39% of people say deals and discounts are the top reasons for them to embrace social commerce. 33% say it’s the ease of purchase. That goes to show that people actively look out for discount offers on social media and that these platforms are the best place to promote those deals. (Statista)
19. Nearly 40% of Facebook users shop for things on the marketplace. Although not a playground for brands, the Facebook marketplace has become one of the most popular avenues for pre-loved things. (Capital One Shopping)
20. Facebook is the most preferred social commerce platform, followed by Instagram (also owned by Meta). As the breakthrough social media platform, Facebook still rules when it comes to shopping. In other words, it’s a critical channel for digital advertising, especially for B2C brands. (Statista)
21. Around 50% of people report shopping through Instagram every week. As a visual-first platform, Instagram continues to influence people’s online spending behavior. It’s particularly popular for fashion, beauty, skincare, and lifestyle products. (WebFX)
22. There are over 35 million social buyers on TikTok. Ever since TikTok launched the TikTok Shop feature, it has seen tremendous growth in gross merchandise value as well as spending from its users. (Statista)
23. A whopping 85% of US sales on TikTok Shop are in the health and beauty products. TikTok, in particular, is known for making skincare routines, makeup hacks, and beauty products viral. TikTok advertising is a must for such products, with sponsored content as well as influencer collaborations. (Statista)
24. Shoppers on Pinterest spend twice as much money per month compared to other platforms. Pinterest is the go-to for shoppers who go for visual appeal. And apparently, they are willing to spend more, which makes it a rather strategic channel to explore for brands that haven’t yet explored it. (Pinterest)
Mobile Consumer Spending Statistics
What devices your customers are using is just as important as the channels they’re using. And from the data, it seems more and more consumers are using mobile devices to shop for goods and services.
25. Nearly 60% of shoppers use their mobile devices inside stores to compare prices or find deals and coupons. This finding shows that price sensitivity is high among most consumers. Many look for savings. If they can find the same product online for less, they might buy from there instead of in-store. That’s why many retailers offer price-matching guarantees. (Invoca)
26. Consumers who search for businesses on mobile are 39% more likely to call them. And as a lot of people search on phones, this number is simply huge. Creating a business on search engines like Google is essential for visibility, even more so for localized targeting. (Google)
27. Mobile commerce makes up 38% of overall digital spending in the US. Again, this is a huge number, considering online shoppers in the US are in the tens of millions. Brands must present responsive websites to cater to these mobile-first audiences. (Statista)
28. Three out of four consumers make purchases on their mobile devices because it saves time. Just think about it for a second: we carry our phones with us everywhere. Anyone can shop anywhere at any time with a mobile device in their hands. (Dynamic Yield)
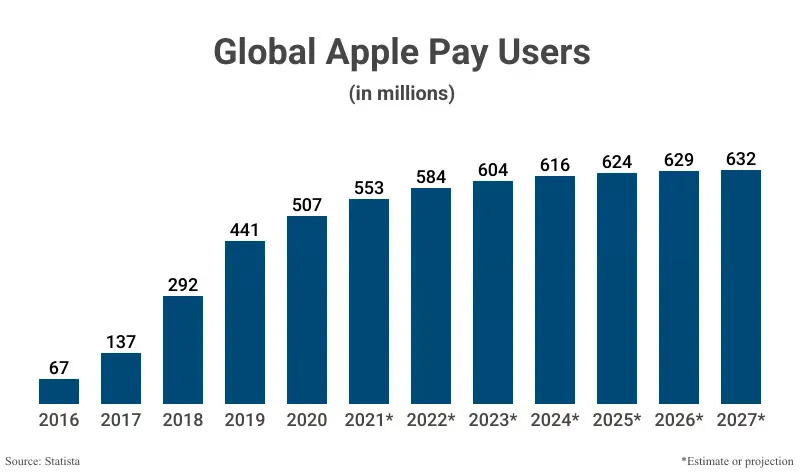
29. Digital and mobile wallet payments make up 49% of all online transactions globally. With Apple Pay, Google Pay, and Samsung Pay becoming increasingly common, consumers are increasingly tapping their phones at tills (in addition to making online payments). (FIS Global)
30. Over 60% of Google Search visits originate from mobile devices. More people are searching for products and services on their phones than ever before. And that only signifies the importance of mobile-first advertising. (Coalition Technologies)
Consumer Behavior Statistics
Consumer expenditures are intrinsically linked with buyer behavior. Brands that take the time to understand their customers are more likely to succeed and achieve a high ROI with paid media. Here are some eye-opening numbers about consumer spending:
31. 98% of customers read reviews before making a purchase. People like to know what their peers are saying about a product or service. And in that vein, reviews can make or break a brand. That's why testimonies are so powerful when it comes to convincing potential buyers. Brands should treat every customer as a key to getting more (and, of course, provide the best experience). (Forbes)
32. User-generated content can be 9.8x more effective than influencer content. While influencer marketing has its benefits, content from regular users can be even more impactful. That’s because it feels more authentic and relatable. (Nosto)
33. UGC is most impactful on the buying decisions of Gen Z and Millennials, with 70% and 78%, respectively, reporting as such. Don’t forget, Millennials and Gen Zs have helped usher in the era of influencer and UGC marketing. (Business Wire)
At inBeat, we help brands leverage UGC to earn customers both organically and with paid promotions. And this strategy delivers higher ROAS than branded content.
34. 76% of consumers prefer to buy from brands that offer personalization. And 84% of customers are more likely to buy from companies that actually see them as people. Generic, catch-all advertising isn’t suited to modern times, when consumers are sophisticated enough to value personalized experiences. That also shows how important collecting data (with consent, of course) is to ensuring your interactions with customers are personalized and contextual. (DemandSage)
35. Young consumers are more likely to wait for discounts than older ones. Younger consumers are also more savvy at finding discounts. They can look for discount codes, free shipping, and other ways to save money. Simply put, they have a higher appreciation for discounts. (Statista)
36. 49% of shoppers will wait at least a month to buy non-essentials if they know they can get a better deal. Again, discounts can be highly attractive for online shoppers, especially for high-ticket items. They're willing to wait to save money. (Ipsos)
37. 48% of people who work from home shop online compared to 38% of those who don’t. Even though many have gone back to the office after the pandemic, many continue to work remotely and spend more time online within their homes for both work and other things, so they’re more inclined to buy online, too. (Retail Economics)
38. 46% of customers will buy from a competitor if their usual brand has a product out of stock. This shows that consumers might not wait too long and shift loyalties if a product isn’t available. And that’s just leaving money on the table. (Shopify)
Travel Spending Statistics
Travel expenditure can also tell a lot about consumer confidence, especially money spent on the hospitality & leisure sector. People usually travel more when they have more disposable income. Also, when they travel, they shop for stuff.
39. Travelers look for special deals to offset budget increases. People would rather look for deals that save them money when traveling than compromise on their choices of destinations, hotels, and transportation. (General Travel Insurance)
40. Interestingly, young people are turning to travel agents. 47% of Millennials and Gen Z consumers said they’re using in-person or online travel agents for their leisure trips, which is a shift from the usual DIY approach many budget-conscious (usually young) travelers take. (Travel Age West)
41. 67% of consumers worldwide who shop while traveling out of their country do so to save money, especially when prices are higher in their own country. This is particularly true for luxury goods. For instance, Americans shop for high-end brands when they travel to Europe because the same labels are much more expensive at home. (Invesp)
42. The global online travel market will reach $1.26 trillion by 2030. It’s growing at a CAGR of 10.6%. Brands in hospitality and travel have a tremendous opportunity when it comes to digital advertising, with channels like social media offering great returns, with the right strategy, of course. (Navan)
Takeaways from Consumer Spending Numbers and Trends
Consumer spending trends paint a clear picture for marketers: behavior is changing, expectations are rising, and complacency is costly. While the channels and tactics may shift, the underlying signals from spending data offer consistent guidance on where brands should focus.
Ecommerce and social commerce continue to dominate.
Online spending is about discovery, speed, and frictionless checkout. Social platforms increasingly act as both sources of inspiration and points of sale.
For marketers, this means creative, community, and conversion shouldn’t be treated as separate efforts. Brands that align storytelling with seamless purchasing journeys are best positioned to capture demand.
Consumer spending remains strong despite inflation and economic concerns, but that could change.
Even amid uncertainty, many consumers continue to spend, particularly on categories tied to lifestyle, convenience, and self-improvement.
However, economic resilience should not be mistaken for immunity.
Marketers should plan for rapid shifts in sentiment by building flexible budgets, testing multiple price and value narratives, and preparing contingency messaging if confidence softens.
Shoppers love discounts, deals, and personalization.
Value matters, but not just in the form of lower prices.
Consumers respond strongly to offers that feel relevant and timely. Personalized promotions, loyalty rewards, and tailored recommendations outperform blanket discounts because they reinforce a sense of recognition.
For marketers, the opportunity lies in using data responsibly to balance margin protection with perceived value.
The holiday season remains critical for retail brands.
Despite changes in shopping behavior, the holiday period continues to concentrate a disproportionate share of annual spending.
Consumers plan earlier, compare more options, and expect seamless experiences across channels.
Brands that treat the holiday season as a year-long strategy tend to win both revenue and long-term customer loyalty.
A mobile-first approach to online stores is non-negotiable.
Mobile isn’t a secondary touchpoint.
From discovery to checkout, consumers expect fast load times, intuitive navigation, and mobile-optimized payment flows.
Remember: Any friction in the mobile experience directly impacts conversion.
For marketers, mobile performance should be considered part of the brand promise.
Overall takeaway:
Consumer spending trends emphasize adaptability. Brands that stay close to how, where, and why people spend are better equipped to adjust messaging, optimize channels, and remain competitive as economic and behavioral conditions evolve.
Marketing is at the heart of it all, especially when pivoted to consumer spending patterns. Smart brands understand the power of messaging and use signals like household spending and business conditions to tailor their campaigns.
At inBeat, we understand that fully. Our client campaigns are goal-oriented and grounded in real conditions on the ground. And we know how to capitalize on consumer confidence, whether it’s strong or fleeting, with the right message.
Check out our work to see the results yourself.
FAQ
Where can brands track consumer spending data?
Brands can monitor consumer spending through a mix of public and private sources, including the U.S. Bureau of Labor Statistics for consumer expenditure trends, the Federal Reserve for macroeconomic indicators, and commercial providers such as Nielsen and Mastercard that offer transaction-level and category-level insights. Digital demand signals can also be observed through platforms like Google, using search and shopping trends.
How quickly do consumer spending trends change?
Spending behavior can shift rapidly in response to inflation, economic news, seasonality, or cultural moments. While some changes are cyclical, others, such as the move to ecommerce or mobile-first shopping, are more structural and long-lasting.
Does strong consumer spending always mean higher brand performance?
Not necessarily. Overall spending may remain strong while consumers trade down, delay purchases, or favor specific channels or brands. Performance depends on how well a brand’s pricing, messaging, and experience align with current consumer priorities.
How should brands use consumer spending insights in practice?
Spending data works best when combined with first-party customer data and campaign performance metrics. Together, they help brands refine targeting different demographic groups, personalize offers, optimize channels, and anticipate shifts in demand before they appear in sales reports.