


.svg)
.svg)
.svg)
.svg)

.svg)


When brands compare NYC creators vs LA creators, the conversation usually centers on culture, aesthetics, or audience size.
But what actually matters is performance. Engagement depth, watch time behavior, conversion intent, and paid media efficiency may differ depending on where the creator ecosystem is rooted.
If you are allocating budget across New York City and Los Angeles, you are not choosing between two cities. You are choosing between two performance structures.
On platforms like Instagram and TikTok, surface metrics can look similar while deeper conversion signals tell a very different story.
This guide breaks down how NYC and LA creators perform across engagement, short-form retention, conversion behavior, paid amplification, and funnel stage impact so you can allocate creator spend with clarity.
P.S. Still unsure whether NYC or LA creators will actually drive revenue for your brand instead of just engagement? At inBeat Agency, we structure creator testing around real performance data and measurable funnel impact. Book a free strategy call now.
Key Takeaways
- NYC and LA creators differ more in performance structure than in creative quality.
- NYC creators drive deeper engagement through discussion and saves.
- LA creators frequently generate faster momentum and broader early reach.
- Hook strategy differs, with LA leaning into trend energy and NYC leaning into perspective.
- Conversion strength depends heavily on product category and purchase complexity.
- CTR behavior varies based on timing and content structure.
- NYC content often supports mid-funnel campaigns, while LA content scales efficiently at the top.
- Creative fatigue refresh strategies differ between visual variation and topic evolution.
Do NYC and LA Creators Actually Perform Differently?
Yes, NYC creators perform differently than LA creators. The difference shows up in how content behaves across formats, platforms, and funnel stages. And you won’t see that reflected in surface-level metrics alone.
When you compare creators from New York City and Los Angeles, follower count rarely tells the full story. Two creators can look similar on paper. However, their audience behavior, retention patterns, and conversion tendencies may vary once a campaign goes live.
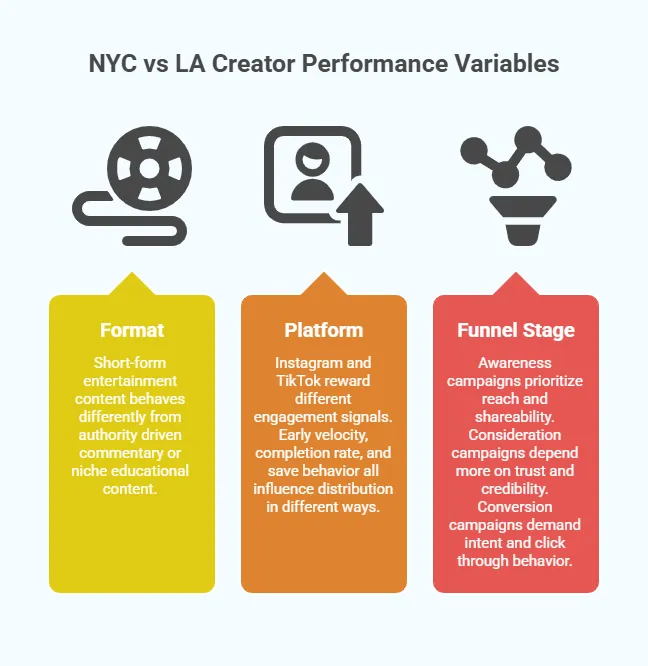
You need to evaluate three variables before making assumptions.
- First, format. Short-form entertainment content behaves differently from authority-driven commentary or niche educational content. Each city has ecosystems that lean toward certain formats more naturally.
- Second, platform. Instagram and TikTok reward different engagement signals. Early velocity, completion rate, and save behavior all influence distribution in different ways.
- Third, the funnel stage. Awareness campaigns prioritize reach and shareability. Consideration campaigns depend more on trust and credibility. Conversion campaigns demand intent and click-through behavior.
If you approach the matter of NYC creators versus LA creators with a clear objective, the comparison becomes much easier to make. Instead of asking which city has better creators, you start asking which performance pattern aligns with your growth goals.
NYC Creators vs LA Creators: A Quick Comparison Table
Here’s a side-by-side comparison so you can see exactly how creators in New York City and Los Angeles differ across core performance metrics.
1. NYC Creators vs LA Creators: Engagement Rate Differences
When you compare influencers in LA and NYC, engagement rate is usually the first metric you look at. However, the structure of that engagement mostly matters more than the percentage itself.
NYC Creators Engagement Patterns
If you work with New York City creators, you will notice deeper interaction in the comments. Instead of short reactions, you see longer responses, opinions, and back-and-forth conversations. This depth signals stronger audience investment.
Across social platforms in 2026, average engagement rates sit around 1.8% per post, with video formats typically outperforming static content. In NYC’s niche and insight-driven content scenes, you can often see engagement exceed that average when followers actively save or discuss a post.
You will typically notice:
- Higher comment depth with thoughtful responses
- More discussion threads under a single post
- Stronger save rates on informational or insight-driven content
When a creator shares commentary or niche expertise, followers respond with questions and perspectives of their own.
As per our experience, this type of interaction can strengthen trust over time. If you are promoting something that requires consideration, saves and discussion become valuable metrics.
LA Creators Engagement Patterns
With creators in Los Angeles, engagement looks different from the start. You might see higher like velocity in the first few hours. This early momentum can help content travel further within the platform.
You will commonly observe:
- Faster early engagement spikes
- Stronger shareability for lifestyle or entertainment-driven posts
- High reaction volume tied to personality and relatability
When content feels aspirational or trend-aligned, followers are more likely to send it to friends or repost it. This behavior supports broader distribution and reach.
You might miss these structural differences when you analyze creators in these two cities through engagement rate alone
Remember: If you care about depth and discussion, NYC creators may align better. If you prioritize fast momentum and broad distribution, LA creators may fit your objective more closely.
NYC Creators vs LA Creators: Engagement Snapshot
2. NYC Creators vs LA Creators: Short-Form Video Performance
When you compare NYC and LA creators on short-form video, you start to see clear behavioral differences. On platforms like Instagram and TikTok, early retention and watch time directly affect distribution. This means structure matters as much as creativity.
NYC Creators vs LA Creators: Hook Retention (First 3 Seconds)
A strong hook in the first 3 seconds is critical. On TikTok and Instagram, a big chunk of viewers will scroll past if they aren’t hooked immediately. In fact, about 33% of users swipe past a video in the first 3 seconds if the opening doesn’t grab them.
Strong intros (emotion, curiosity, trend cues) significantly improve both engagement and watch-through rates.
If you are running campaigns with LA creators, you will mostly see hooks built around:
- Trend-based audio or visual cues
- Visual movement
- Emotional triggers.
The goal is immediate attention. Strong facial expression, fast cuts, or familiar audio can pull viewers in quickly.
With NYC creators, hooks feel more perspective-driven. You may see:
- Bold opening statements
- Strong POV driven commentary
- Niche-specific framing that signals expertise
Instead of relying on trend familiarity, the hook relies on curiosity or expertise.
If your priority is rapid attention in crowded feeds, LA style hooks can generate early traction. And if you are targeting viewers who care about substance, NYC style openings may hold attention differently.
NYC Creators vs LA Creators: Average Watch Time
Watch time tells you whether people stay. Looking at broader short-form trends, videos under 90 seconds typically see about 50% viewer retention across platforms.
This means half of the people stick around long enough to see meaningful content, and strong hooks or valuable structures push that higher.
LA creators perform strongly when the content leans into entertainment, storytelling, or lifestyle moments. Viewers stick around because they want to see what happens next.
NYC creators perform well when the video delivers structured value. Informational breakdowns, opinion pieces, or niche insights can drive higher completion rates when the audience feels they are learning something useful.
If your product requires explanation, longer informational retention can support stronger mid-funnel results.
NYC Creators vs LA Creators: Viral Potential vs Consistency
When you look at New York City and Los Angeles creators through a viral lens, the pattern shifts again.
- LA creators usually generate spike-based performance. A trend-aligned post can surge quickly and travel far within hours.
- NYC creators, in contrast, show steadier performance curves. Instead of sharp peaks, you may see consistent engagement over time. Content can continue attracting saves and discussion even after the first wave of distribution.
If you are chasing breakout visibility, LA creators may support that objective. However, if you prefer predictable performance tied to topic relevance, NYC creators may align better.
3. NYC Creators vs LA Creators: Conversion Performance Differences
This is where the matter of NYC vs LA creators becomes more than a visibility debate. Engagement is important, but conversion tells you whether attention turns into action.
According to industry benchmarks, influencer content across niches averages about a 0.8% conversion rate. This means roughly 8 out of every 1,000 users take a desired action like clicking through or buying after seeing influencer content
If you are running direct response campaigns, you will start to notice that different creator ecosystems support different buying behaviors.
NYC Creators vs LA Creators: Direct Response Conversions
When you work with NYC creators, stronger performance usually appears in categories that require explanation or context.
You will commonly see stronger results in:
- Finance and fintech products
- Tech platforms or SaaS tools
- Career development services
- High consideration purchases that require explanation
Audiences in these niches evaluate before they act. If a creator positions the offer with context, insight, or credibility, conversion rates can reflect that deeper intent.
With LA creators, conversion patterns shift toward lifestyle-driven categories. You may see stronger performance in:
- Beauty and skincare
- Wellness and fitness
- Apparel and fashion drops
- Low-friction impulse purchases
In these categories, the product fits naturally into the creator’s content style. This alignment supports faster buying decisions.
Remember: When you compare creators in New York City and Los Angeles at the purchase stage, the difference reflects product complexity rather than creative quality.
NYC Creators vs LA Creators: Link Click-Through Rate (CTR) Behavior
CTR tells you how the content structure influences action.
With NYC creators, clicks mostly occur after the key value points are delivered. The viewer stays through the explanation and then moves toward the link once the offer makes sense.
You might notice that:
- CTA placement performs better after information is presented
- Longer captions can improve click intent
- Structured breakdowns support stronger link engagement
With LA creators, clicks happen closer to the emotional peak of the video. A strong visual moment or lifestyle reveal can drive immediate curiosity.
Here, you may see:
- Click spikes early in the content
- Stronger response to short, direct CTAs
- High tap through during trend-aligned moments
When you evaluate creators in LA and NYC through CTR timing, the difference becomes structural. In many cases, NYC content converts after context, while LA content drives action during momentum.
4. NYC Creators vs LA Creators: Paid Media Amplification Efficiency
When you compare creators in these two US cities, organic metrics only tell part of the story. The real difference usually shows up once you put paid spend behind the content.
If you are running whitelisted ads or creator-led paid campaigns, you will start to see how each ecosystem behaves under budget pressure.
NYC Creators vs LA Creators: Whitelisting Performance
With NYC creators, content mostly performs strongly in mid-funnel campaigns. Once your audience has some awareness, commentary-driven or insight-based content can support retargeting and consideration stage ads.
You may notice that NYC content works well when:
- The audience already knows the brand
- The message requires explanation
- The ad focuses on credibility or value
The performance improves because the viewer is already evaluating.
With LA creators, scaling works differently. Lifestyle-driven content supports top-of-funnel awareness more efficiently. The visuals and personality fit naturally into cold audience feeds.
You may find that LA content scales well when:
- You are targeting broad audiences
- You want fast reach and high impressions
- The creative focuses on visual appeal or trend energy
The content blends into the feed while still driving attention.
NYC Creators vs LA Creators: CPM and Creative Fatigue
When you start increasing spend, creative fatigue becomes even more important.
This is not just a media buying issue. Research from Nielsen shows that creative quality drives 56% of campaign sales impact. That means the longer your creative stays effective, the more revenue you gain from it.
LA lifestyle content may fatigue slower visually because the format relies on aesthetic variety and movement. As long as visuals feel fresh, performance can remain stable for longer stretches.
NYC commentary-driven content refreshes differently. Instead of visual variation, the refresh comes from new angles, new takes, or updated insights. Topic shifts can extend performance without major production changes.
When you evaluate creators in Los Angeles and NYC through paid amplification efficiency, the difference becomes strategic. NYC content can strengthen mid-funnel conversion flows. LA, in contrast, content can drive scalable awareness at the top.
If you understand where each fits inside your paid structure, you can allocate spend more intelligently instead of treating all creator content the same.
NYC Creators vs LA Creators: Funnel Stage Comparison
When you step back and look at creators in LA and NYC through a funnel lens, the differences become easier to map. Instead of debating which city performs better, you can align each ecosystem with a specific stage of growth.
Awareness
If your goal is broad visibility, LA creators are known to deliver higher reach. Lifestyle-driven visuals and personality-led storytelling perform well with cold audiences. This makes Los Angeles creators strong at the top of the funnel when you want impressions and rapid exposure.
New York City creators can support awareness as well, but reach is usually more moderate. Their content typically resonates strongest once viewers are already interested in the topic.
Consideration
This is where NYC creators mostly stand out. Commentary, structured breakdowns, and niche expertise help audiences evaluate. If your campaign requires explanation or comparison, New York City creators can support stronger mid-funnel engagement.
LA creators still drive interest at this stage, but authority-driven positioning is usually less central than personality and visual appeal.
Conversion
When you focus on conversion, the pattern becomes category-specific. NYC creators convert well in niche verticals where context matters. LA creators convert well in lifestyle-driven categories where emotional alignment influences purchase decisions.
Your product type often determines which ecosystem aligns better here.
Retention
Retention looks different across both cities.
NYC creators retain audiences within information-heavy or expertise-based niches. Viewers return for insight, updates, or evolving commentary.
LA creators retain audiences through personality and lifestyle consistency. Followers stay because they connect with the creator’s identity and tone.
When you evaluate creators across the full funnel, the takeaway becomes clear.
LA creators frequently dominate at the top with reach and awareness. NYC creators, on the other hand, frequently strengthen the middle with authority and evaluation. Conversion and retention depend more on product type and audience intent.
If you map your objective to the right stage, the city choice becomes much more strategic.
NYC Creators vs LA Creators: Which Performs Better Overall?
There is no universal winner. Creators in NYC typically perform better for authority-driven metrics such as consideration and niche conversions, while LA creators lead in entertainment-driven reach, awareness, and viral momentum. The better choice depends on your funnel stage and campaign objective.
Turn Creator Strategy into Growth with inBeat Agency
If you want to choose the right creators based on real performance data, inBeat Agency helps you structure that decision with clarity. We design controlled creator testing frameworks, align content to the funnel stage, and optimize amplification so you scale what actually converts.
Whether you are prioritizing awareness, consideration, or direct response, we help you identify which ecosystem supports your growth objectives and how to deploy budget efficiently.
Book a free strategy call now and see where your creator performance can improve.
FAQs
Do NYC creators have higher engagement rates than LA creators?
Not necessarily higher, but usually deeper. NYC creators generate stronger comment quality and save behavior, while LA creators tend to produce faster engagement spikes driven by likes and shares. The structure of engagement differs more than the percentage itself.
Are NYC creators more effective for high consideration products?
In many cases, yes. NYC creators are known to perform well when products require explanation, context, or credibility. Finance, tech, and career-related offers typically benefit from authority-driven content that supports evaluation before purchase.
Do LA creators perform better for top-of-funnel awareness campaigns?
Mostly, yes. LA creators frequently generate higher reach and early momentum, especially with visually appealing or trend-aligned content. That makes them strong for cold audience targeting and rapid exposure.
Should brands test both NYC and LA creators for performance optimization?
In most cases, yes. Testing both ecosystems allows you to compare reach, engagement depth, conversion behavior, and paid scalability. Structured testing removes assumptions and helps you allocate budget based on measurable results.
Does inBeat Agency manage both creator sourcing and paid media amplification?
Yes, we handle both. We source and vet creators based on performance alignment, then integrate their content directly into structured paid media campaigns. This allows us to control creative quality, targeting, and scaling under one unified strategy instead of splitting execution across teams.
How does inBeat Agency structure funnel stage testing for creator campaigns?
We map creator content to specific funnel stages before launch. Our team tests awareness driven assets separately from consideration and conversion-focused creatives, so we can measure performance at each stage. This structure helps us identify which ecosystem and format drives measurable impact.
How does inBeat Agency reduce creative fatigue when scaling creator ads?
We prevent fatigue through controlled creative iteration. Our team continuously rotates angles, hooks, messaging structures, and creator variations instead of relying on one winning asset. This keeps performance stable as spend increases and protects efficiency while scaling campaigns.